- Analytics
- News and Tools
- Market News
- AUD/JPY Price Analysis: Bulls propels pair near 105.00
AUD/JPY Price Analysis: Bulls propels pair near 105.00
- AUD/JPY got propelled near 105.00 on Tuesday, driven by the Reserve Bank of Australia RBA's hawkish hold.
- Tusaday's move confirms a positive short-term outlook.
- Fundamentals may have driven the pair out of the consolidation phase seen in the last sessions.
In Tuesday's session, the AUD/JPY pair received a boost following the Reserve Bank of Australia (RBA)'s hawkish hold, with the momentum propelling the pair towards the 105.00 level. In the last sessions, price action saw a consolidation above the 104.00 level, which supported the pair now to retest cycle highs.
On the daily scale, the Relative Strength Index (RSI) stands at 62, indicating rising buying pressure and shifting into bullish territory. However, it is important to observe that the Moving Average Convergence Divergence (MACD) line is below the signal line, hinting that there is still bearish activity. Traders will need to keep an eye on a possible crossover in the upcoming sessions to confirm the continuation of Tuesday's bullish movements.
AUD/JPY daily chart
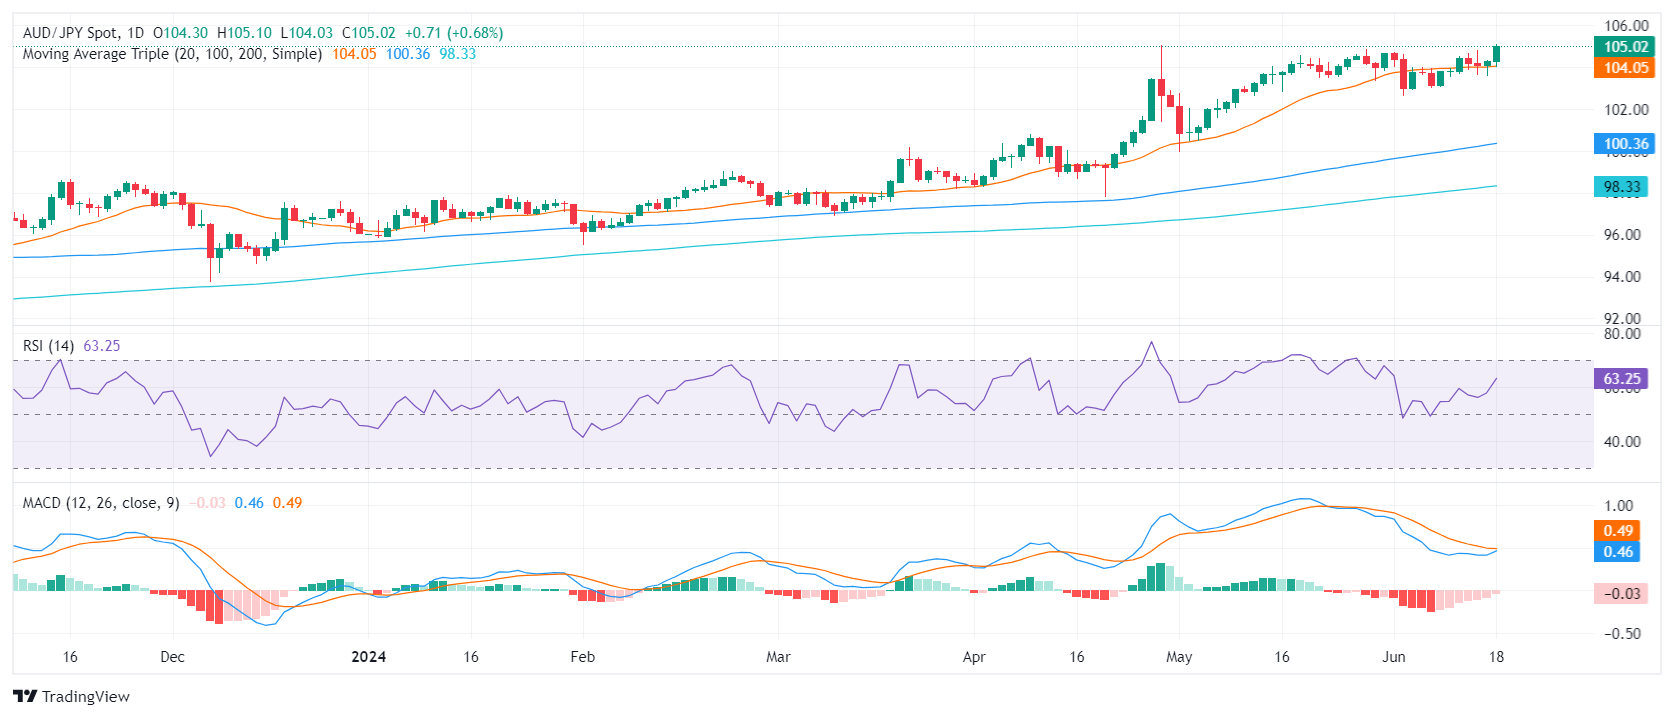
To sum it up, the AUD/JPY pair's solid performance on Tuesday supplements a broader bullish trend, with the trend's strength substantiated by the pair's value above the 20-day, 100-day, and 200-day SMAs. In the next sessions, traders can expect the pair to continue its uptrend movement within the 105.00-106.00 range as bulls have terrain to continue climbing with indicators far from overbought conditions.
On the flip side, if there is a breach below the established support level at 104.00 (20-day SMA), the pair may be prompted to find new support levels. The 102.50 and 100.35 levels are hence seen as the next potential support lines.


© 2000-2026. All rights reserved.
This site is managed by Teletrade D.J. LLC 2351 LLC 2022 (Euro House, Richmond Hill Road, Kingstown, VC0100, St. Vincent and the Grenadines).
The information on this website is for informational purposes only and does not constitute any investment advice.
The company does not serve or provide services to customers who are residents of the US, Canada, Iran, The Democratic People's Republic of Korea, Yemen and FATF blacklisted countries.
Making transactions on financial markets with marginal financial instruments opens up wide possibilities and allows investors who are willing to take risks to earn high profits, carrying a potentially high risk of losses at the same time. Therefore you should responsibly approach the issue of choosing the appropriate investment strategy, taking the available resources into account, before starting trading.
Use of the information: full or partial use of materials from this website must always be referenced to TeleTrade as the source of information. Use of the materials on the Internet must be accompanied by a hyperlink to teletrade.org. Automatic import of materials and information from this website is prohibited.
Please contact our PR department if you have any questions or need assistance at pr@teletrade.global.
transfers