- Analytics
- News and Tools
- Market News
- NZD/USD Price Analysis: Further decline observed as the pair fails to hold the 20-day SMA
NZD/USD Price Analysis: Further decline observed as the pair fails to hold the 20-day SMA
- The NZD/USD slips further below the 20-day SMA as bears reinforce their strength.
- Daily chart indicators suggest an ongoing consolidation phase, marked by a slight negative momentum following last Wednesday’s push.
- The pair fell to a low of 0.6105 but bulls managed to clear most of its losses.
The NZD/USD continued its descent on Monday, moving below the 20-day Simple Moving Average (SMA) of 0.6140 the buyers managed to clear most of its daily losses. The pair seems to be stuck in a state of consolidation following the sharp surge last week to 0.6220. Despite buyers' attempts, the 20-day SMA could not be sustained, and losses could potentially extend if this trend continues.
Meanwhile, on the daily chart, the Relative Strength Index (RSI) has maintained its negative momentum, suggesting a faltering buying pressure. The downward orientation of the RSI is consistent with the flat red bars displayed by the Moving Average Convergence Divergence (MACD), further emphasizing the ongoing consolidation narrative.
NZD/USD daily chart
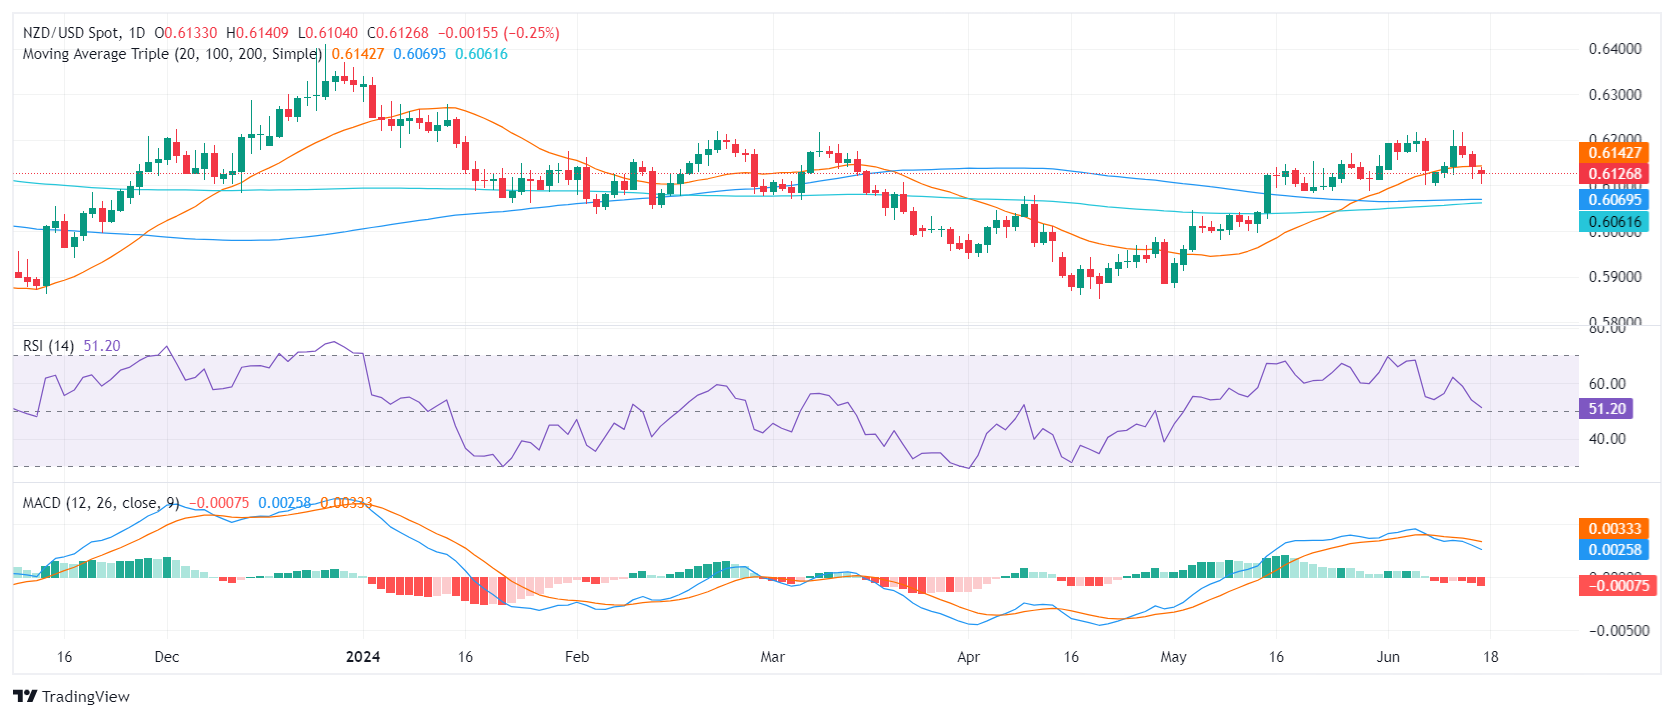
The NZD/USD's immediate resistance level stands at the 20-day SMA of 0.6140. Simultaneously, the convergence of the 100 and 200-day SMAs in the 0.6050-0.6060 region builds a sturdy support base for the pair, which is likely to aid in correction should the bears seize control. Movements below this convergence point could indicate sell conditions.
Furthermore, the main resistance continues to stand at the 0.6200 level. A breach at this point could be viewed as a buy signal, signaling an overturn of the bearish sentiment.


© 2000-2026. All rights reserved.
This site is managed by Teletrade D.J. LLC 2351 LLC 2022 (Euro House, Richmond Hill Road, Kingstown, VC0100, St. Vincent and the Grenadines).
The information on this website is for informational purposes only and does not constitute any investment advice.
The company does not serve or provide services to customers who are residents of the US, Canada, Iran, The Democratic People's Republic of Korea, Yemen and FATF blacklisted countries.
Making transactions on financial markets with marginal financial instruments opens up wide possibilities and allows investors who are willing to take risks to earn high profits, carrying a potentially high risk of losses at the same time. Therefore you should responsibly approach the issue of choosing the appropriate investment strategy, taking the available resources into account, before starting trading.
Use of the information: full or partial use of materials from this website must always be referenced to TeleTrade as the source of information. Use of the materials on the Internet must be accompanied by a hyperlink to teletrade.org. Automatic import of materials and information from this website is prohibited.
Please contact our PR department if you have any questions or need assistance at pr@teletrade.global.
transfers