- Analytics
- News and Tools
- Market News
- WTI Oil Price Analysis: Closing in on cluster of resistance in the $79.00s
WTI Oil Price Analysis: Closing in on cluster of resistance in the $79.00s
- Oil is rising up to a cluster of daily major moving averages in the $79.00s.
- These will probably present a tough level of resistance for the commodity.
- The persistence of the short-term uptrend will depend on a decisive break of this resistance barrier.
WTI Oil is trading in the $78.50s during the US session on Friday.
On the 4-hour chart used to assess the short-term trend Oil has decisively broken out a falling channel and reached the conservative target for the breakout at $78.17 (Fibonacci 0.618 extension of the width of the channel extrapolated higher).
Oil 4-Hour Chart
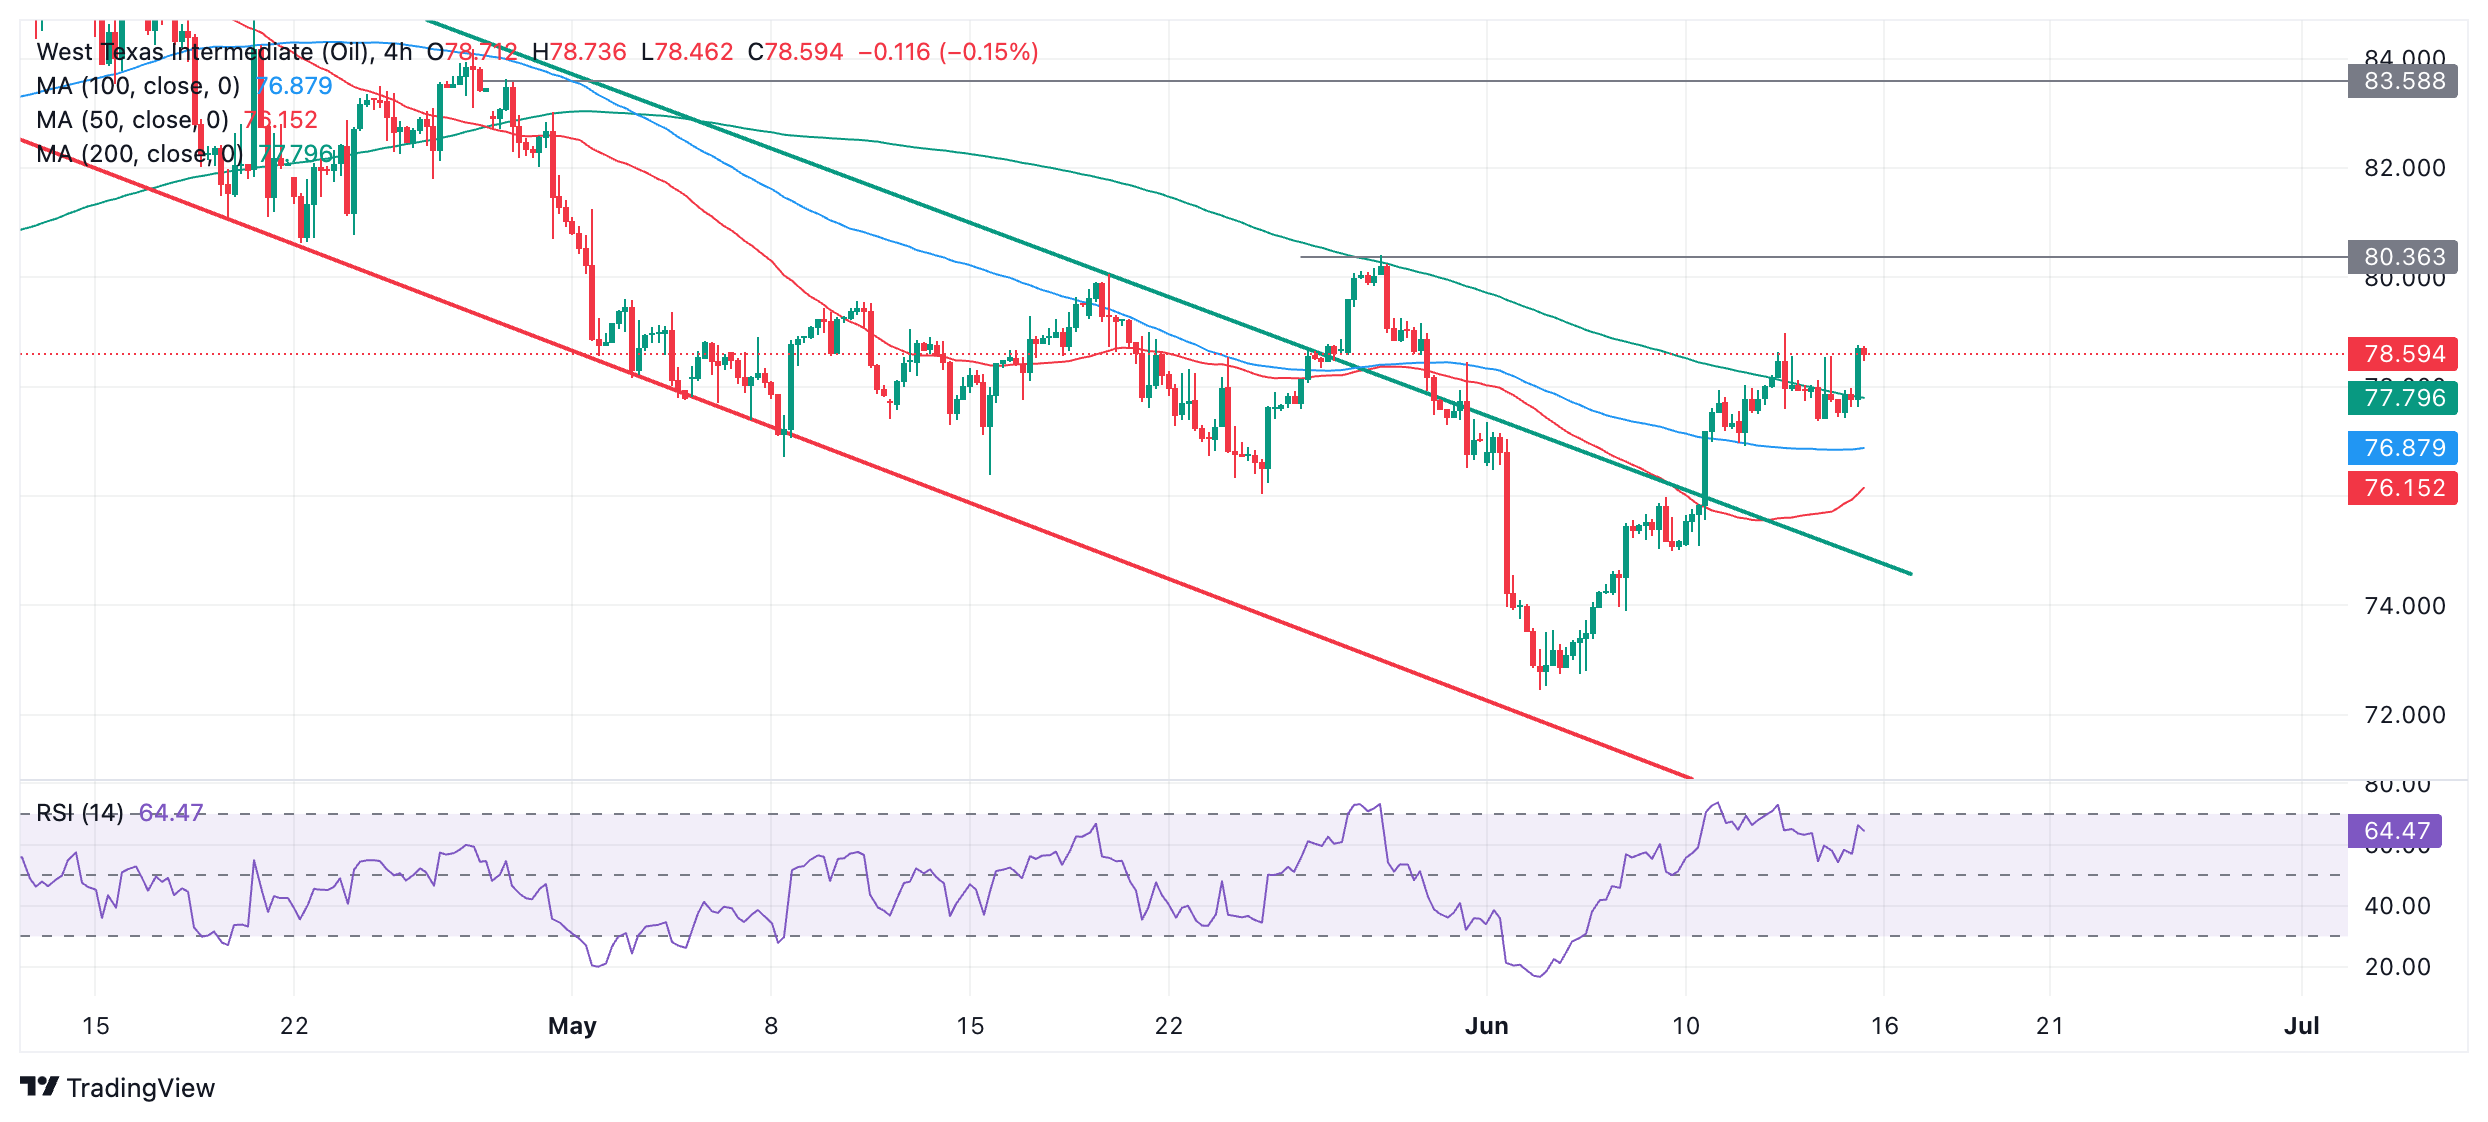
Since breaking out of the channel, Oil is probably now in a short-term uptrend with the odds favoring more upside in the short-term, given “the trend is your friend”. However, it has now reached its initial target so is vulnerable to a pullback.
A breakout above the last lower high of the prior downtrend at $80.36 (May 29 high) would provide added bullish confirmation and extend the uptrend higher. Such a move might be expected to reach the next key target at $83.50 (April 29 high and top of chart gap).
The direction of Oil is less clear on the daily chart used to assess the intermediate term trend.
Oil Daily Chart
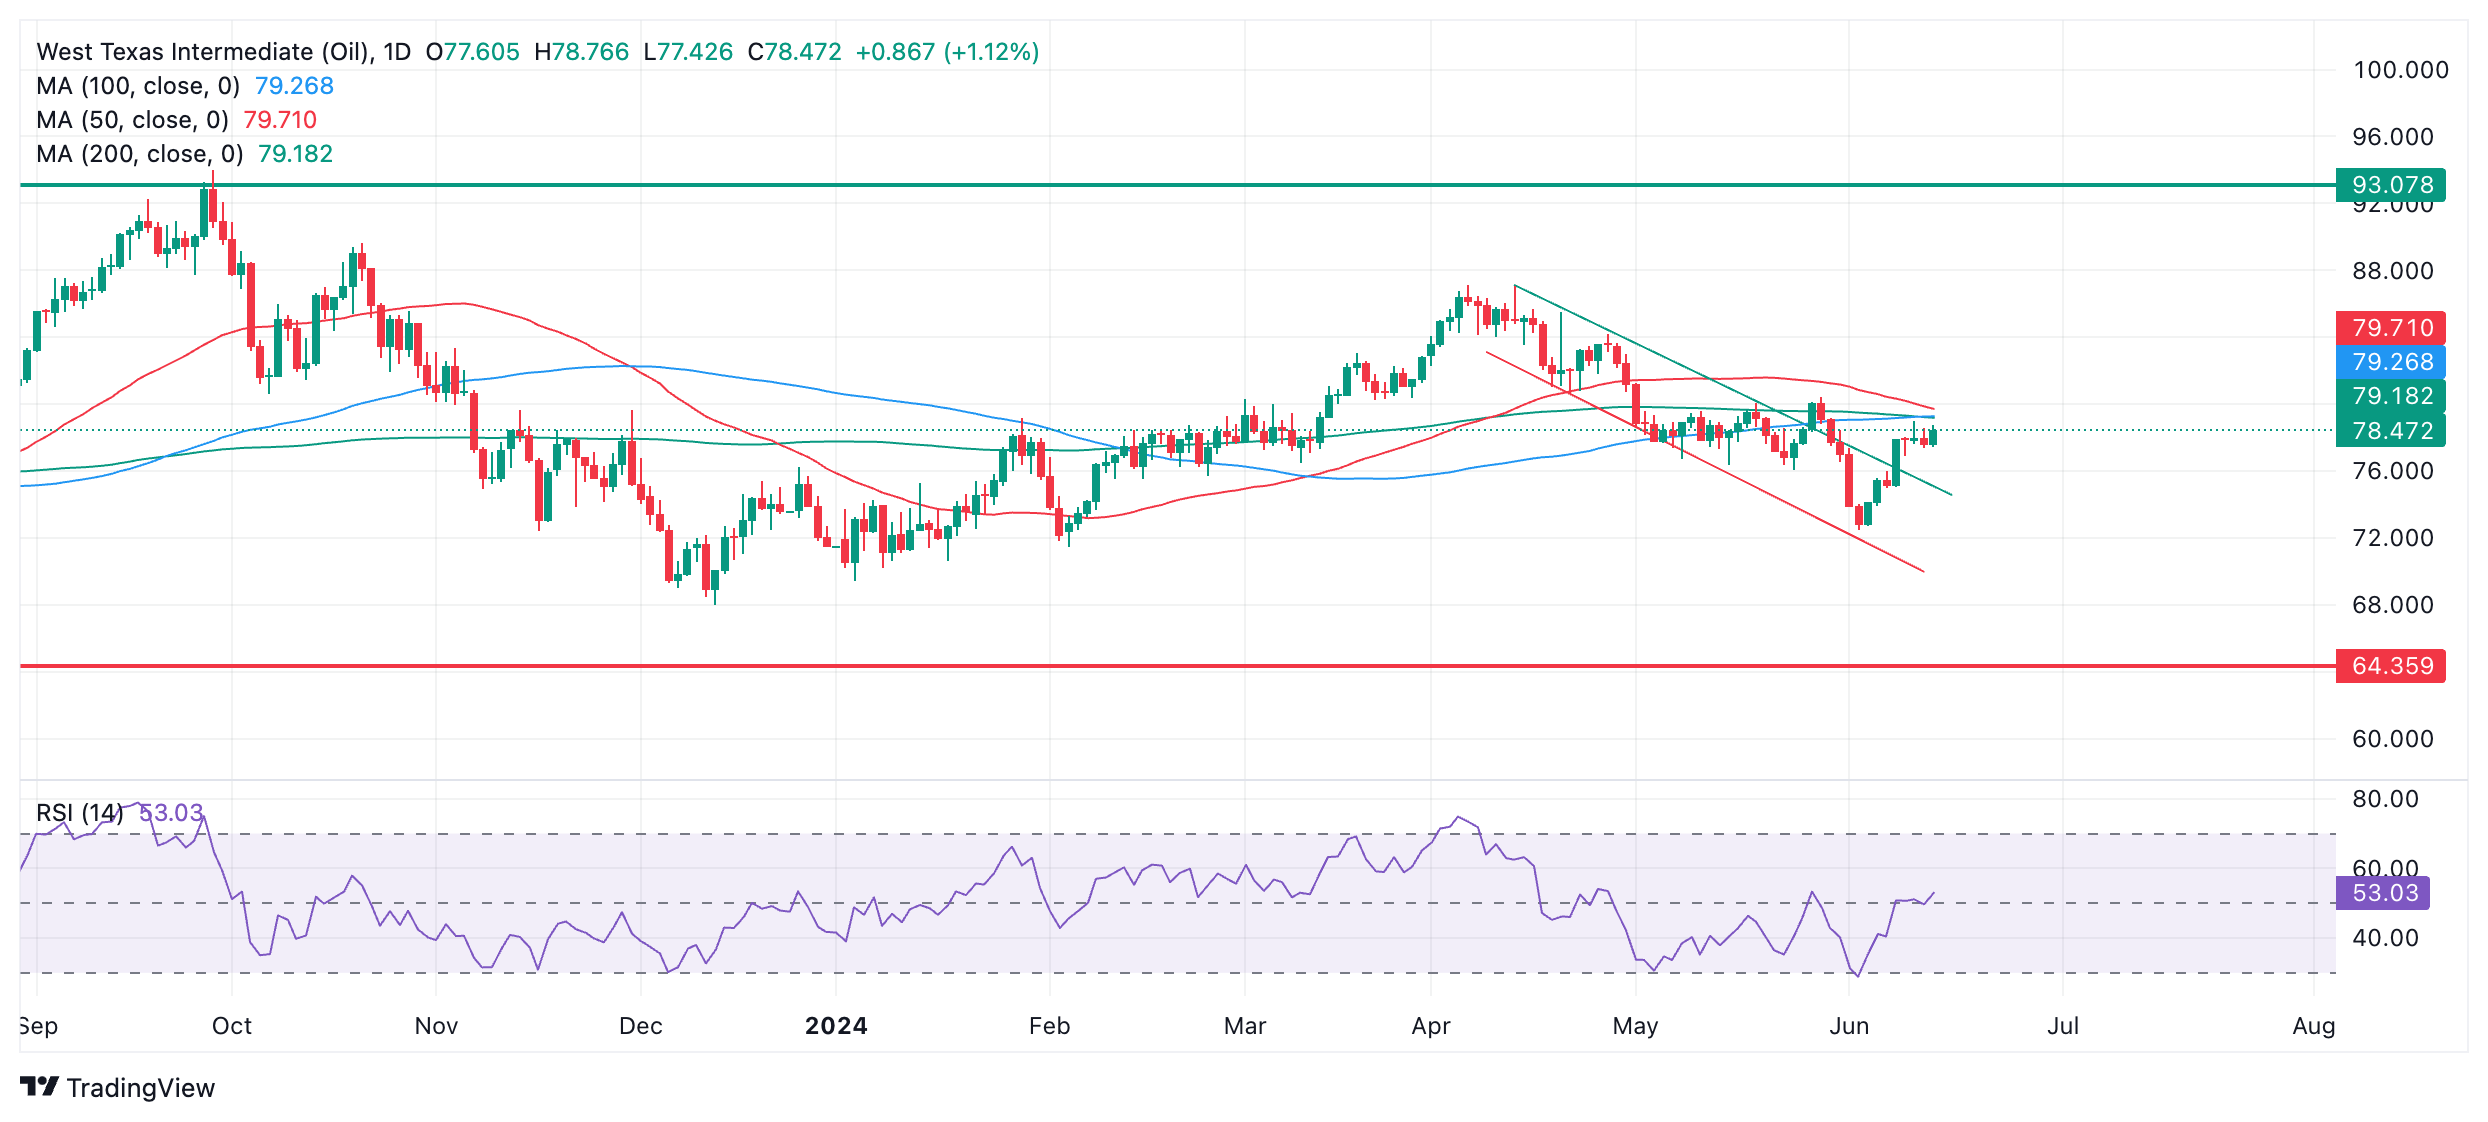
The key feature on the daily chart is the cluster of resistance in the $79s from all three major Simple Moving Averages (SMA) – the 50, 100 and 200-day SMAs. This is likely to present a considerable barrier to more upside and could be an inflection point for Oil price.
It would require a close on a daily basis above $80.36 (May 29 high) to confirm a successful break above resistance from the three SMAs and a continuation up to a target at $83.50.
WTI Oil appears to be trading within a broad long-term range between $64.00 and $93.00 on the weekly chart. This suggests the long-term trend is probably sideways.
Oil Weekly Chart
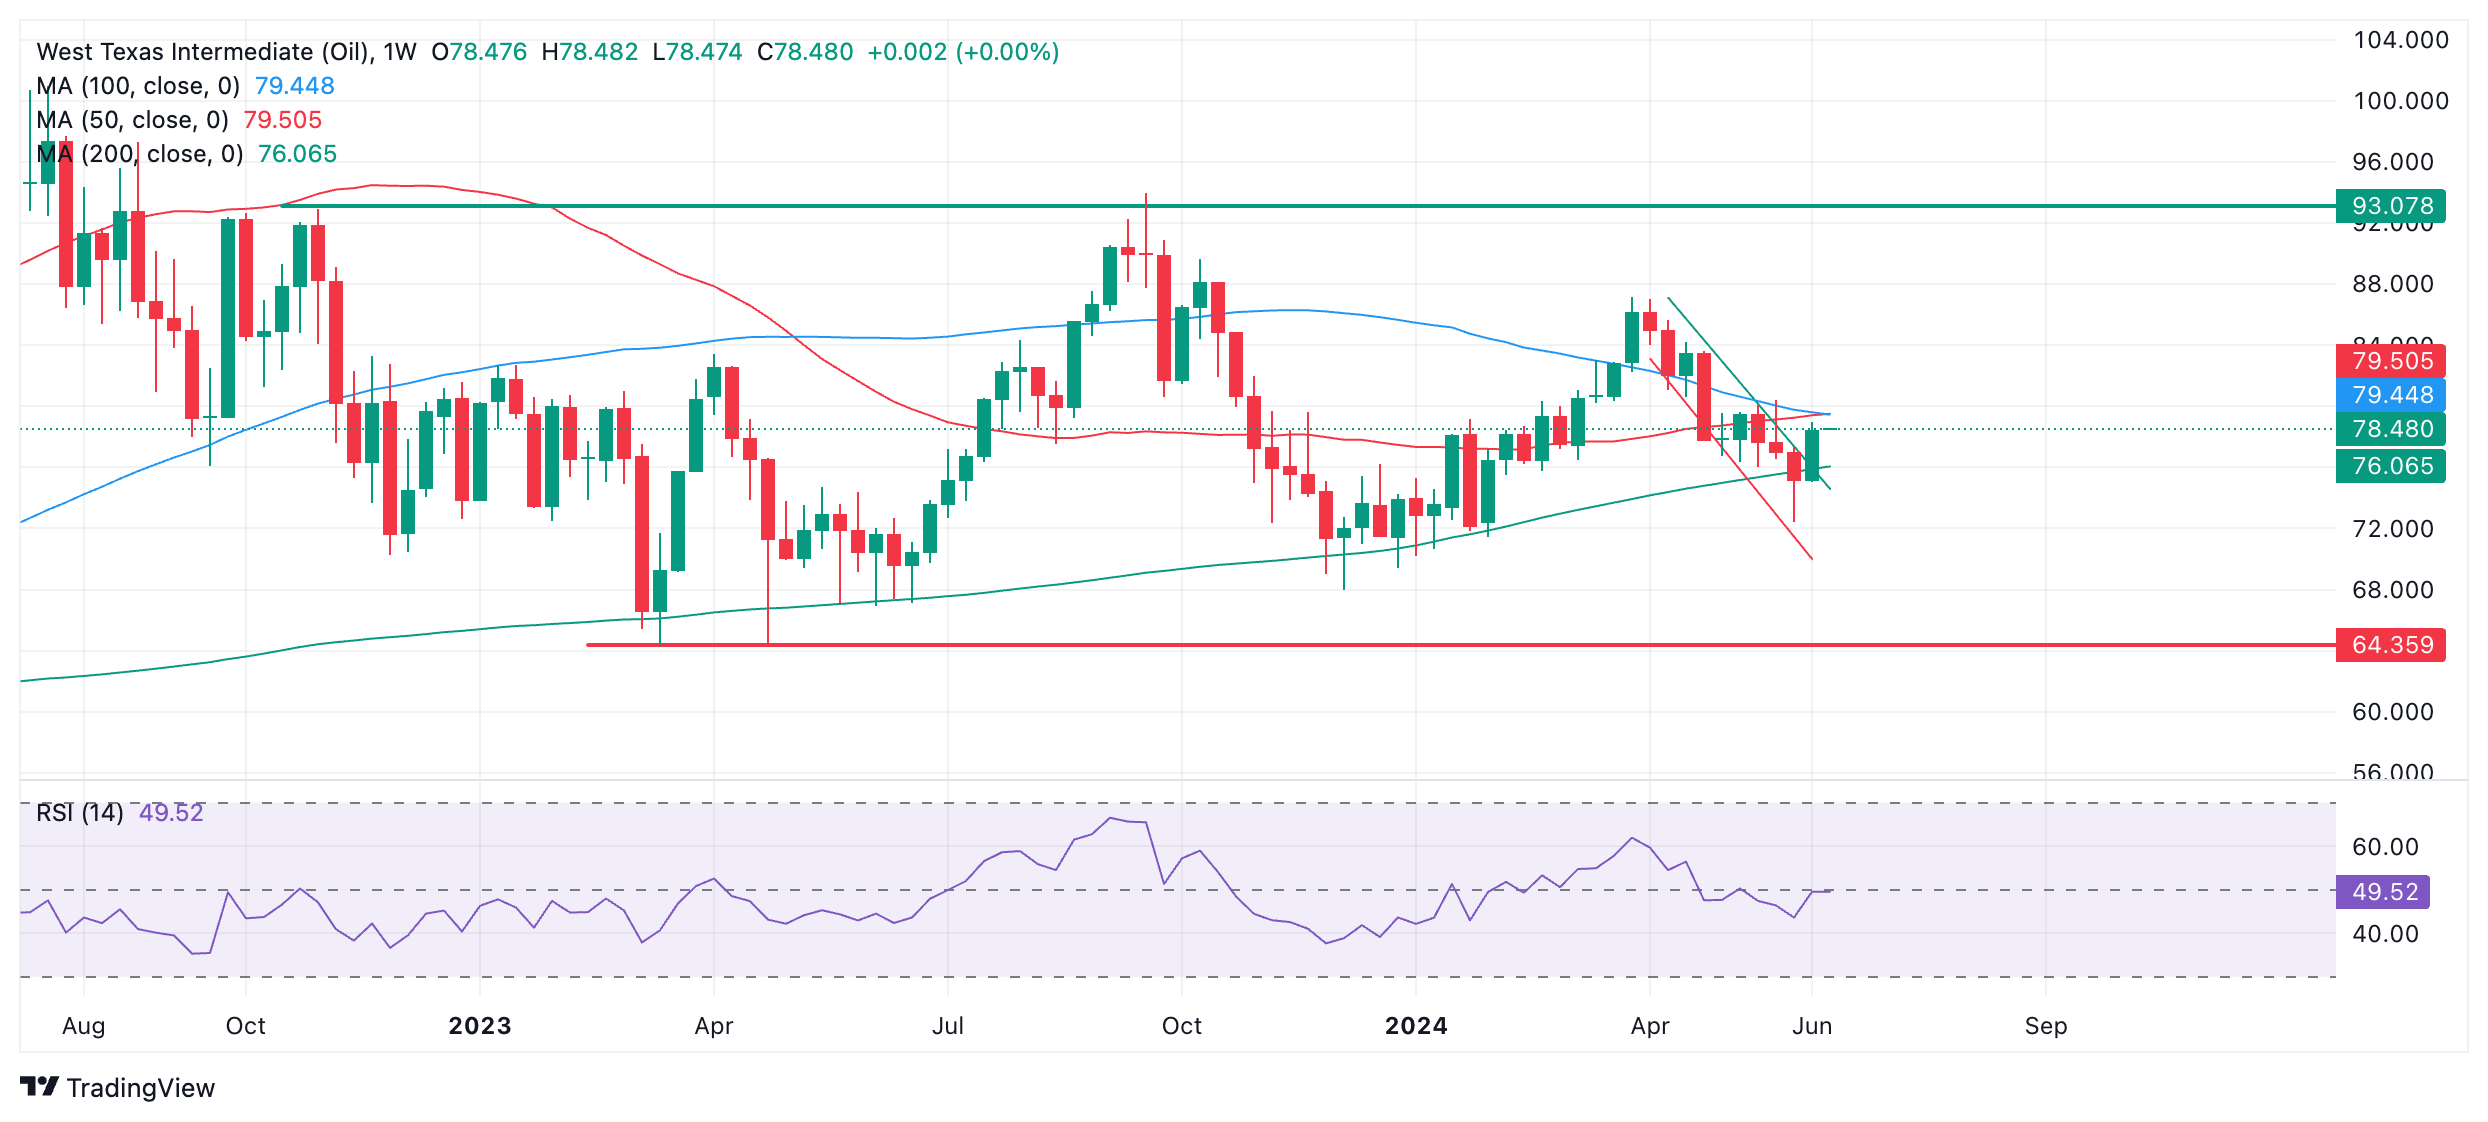
Last week’s red club-shaped candlestick could be a sign the move down has completed and Oil price may be reversing. Similarly-shaped candlesticks often punctuate the end of down moves in asset prices. It is possible Oil price could be about to begin a bullish sequence higher.
The 200-week SMA has acted as reliable support on multiple occasions in 2023-24 and is providing support again at the current week’s lows. The reliability of the 200-week SMA further enhances the case for a bullish reversal.


© 2000-2026. All rights reserved.
This site is managed by Teletrade D.J. LLC 2351 LLC 2022 (Euro House, Richmond Hill Road, Kingstown, VC0100, St. Vincent and the Grenadines).
The information on this website is for informational purposes only and does not constitute any investment advice.
The company does not serve or provide services to customers who are residents of the US, Canada, Iran, The Democratic People's Republic of Korea, Yemen and FATF blacklisted countries.
Making transactions on financial markets with marginal financial instruments opens up wide possibilities and allows investors who are willing to take risks to earn high profits, carrying a potentially high risk of losses at the same time. Therefore you should responsibly approach the issue of choosing the appropriate investment strategy, taking the available resources into account, before starting trading.
Use of the information: full or partial use of materials from this website must always be referenced to TeleTrade as the source of information. Use of the materials on the Internet must be accompanied by a hyperlink to teletrade.org. Automatic import of materials and information from this website is prohibited.
Please contact our PR department if you have any questions or need assistance at pr@teletrade.global.
transfers