- Analytics
- News and Tools
- Market News
- EUR/USD Price Analysis: Remains below 1.0750 after breaking below the rectangle formation
EUR/USD Price Analysis: Remains below 1.0750 after breaking below the rectangle formation
- The EUR/USD pair could test a level of 1.0700 following the throwback support level of 1.0601.
- Technical analysis of the daily chart suggests a bearish bias for the pair.
- The immediate barrier appears at the lower boundary of the rectangle formation around the 50-day EMA at 1.0802.
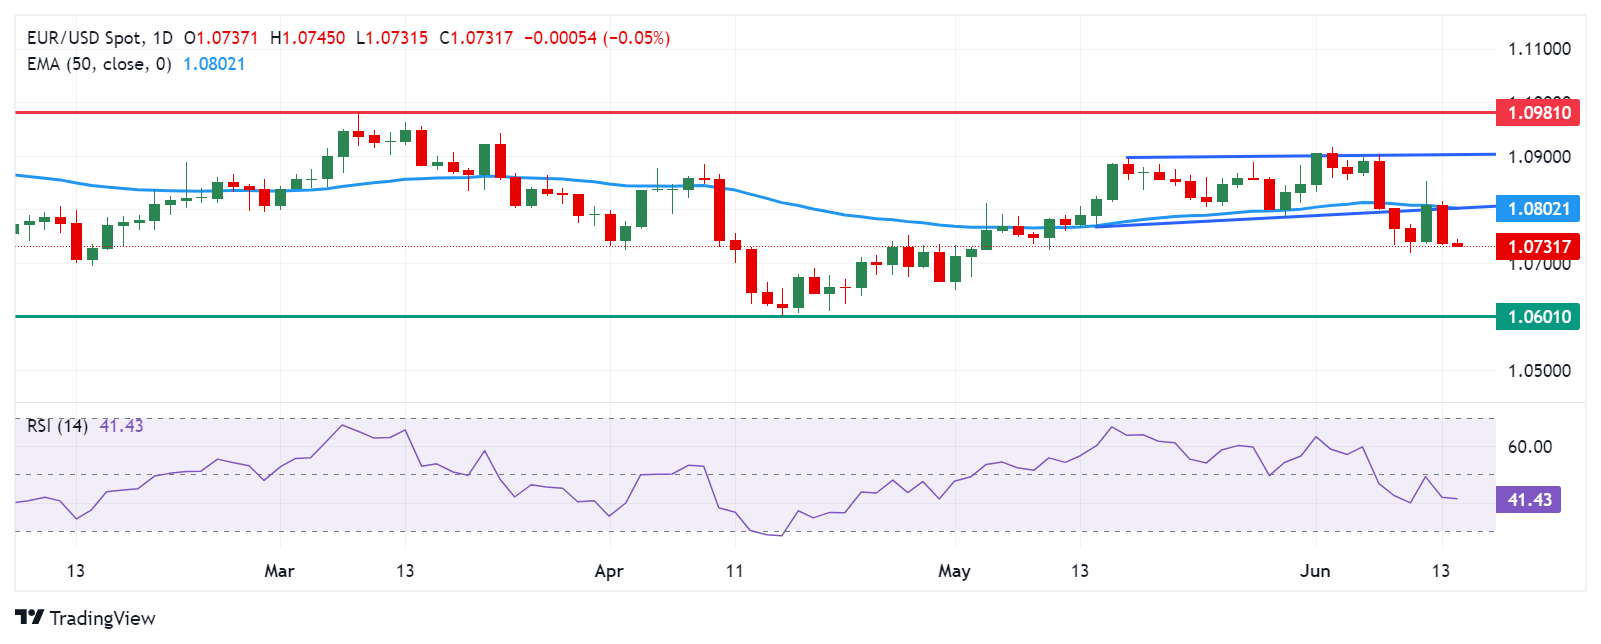
EUR/USD extends its losses for the second consecutive day, trading around 1.0730 during the Asian session on Friday. A technical analysis of a daily chart suggests a bearish bias for the pair, as it struggles below the lower threshold of a rectangle formation.
Additionally, the momentum indicator 14-day Relative Strength Index (RSI) is positioned below the 50 level, suggesting a confirmation of a bearish bias for the EUR/USD pair.
The EUR/USD pair could find immediate support at the psychological level of 1.0700. A break below this level could exert downward pressure on the pair to test the throwback support level of 1.0601.
On the upside, the EUR/USD pair could re-test the lower boundary of the rectangle formation around the 50-day Exponential Moving Average (EMA) at 1.0802. A return to the rectangle formation could weaken the bearish bias and reinforce the pair to explore the psychological level of 1.0900, aligned with the upper boundary of the rectangle formation around the level of 1.0905.
A breakthrough above the latter could support the pair to explore the region around March’s high of 1.0981.
EUR/USD: Daily Chart


© 2000-2026. All rights reserved.
This site is managed by Teletrade D.J. LLC 2351 LLC 2022 (Euro House, Richmond Hill Road, Kingstown, VC0100, St. Vincent and the Grenadines).
The information on this website is for informational purposes only and does not constitute any investment advice.
The company does not serve or provide services to customers who are residents of the US, Canada, Iran, The Democratic People's Republic of Korea, Yemen and FATF blacklisted countries.
Making transactions on financial markets with marginal financial instruments opens up wide possibilities and allows investors who are willing to take risks to earn high profits, carrying a potentially high risk of losses at the same time. Therefore you should responsibly approach the issue of choosing the appropriate investment strategy, taking the available resources into account, before starting trading.
Use of the information: full or partial use of materials from this website must always be referenced to TeleTrade as the source of information. Use of the materials on the Internet must be accompanied by a hyperlink to teletrade.org. Automatic import of materials and information from this website is prohibited.
Please contact our PR department if you have any questions or need assistance at pr@teletrade.global.
transfers