- Analytics
- News and Tools
- Market News
- NZD/JPY Price Analysis: Cross reached multi-year highs, upside appears limited
NZD/JPY Price Analysis: Cross reached multi-year highs, upside appears limited
- Kiwi shows signs of fatigue against the Yen, after reaching highest level since June 2007 on Thursday.
- Indicators on the daily chart suggest potential further consolidation, with trading confined between 95.00 and 97.00.
- A retest of the 97.00 level is possible, but a breach is unlikely as buyers consolidate gains from the significant ascent in May.
On Thursday, the NZD/JPY pair exhibited signs of fatigue, following its advancement to the multi-year highs logged earlier in the week. Clearly, the technical landscape suggests an extension of the consolidation phase, potentially keeping the pair's upside movements capped below the psychological 97.00 level.
The daily Relative Strength Index (RSI) for NZD/JPY has slightly retreated to 59, indicative of a waning in the bullish momentum. The Moving Average Convergence Divergence (MACD) continues to print flat red bars, further endorsing the perspective of ongoing consolidation.
NZD/JPY daily chart
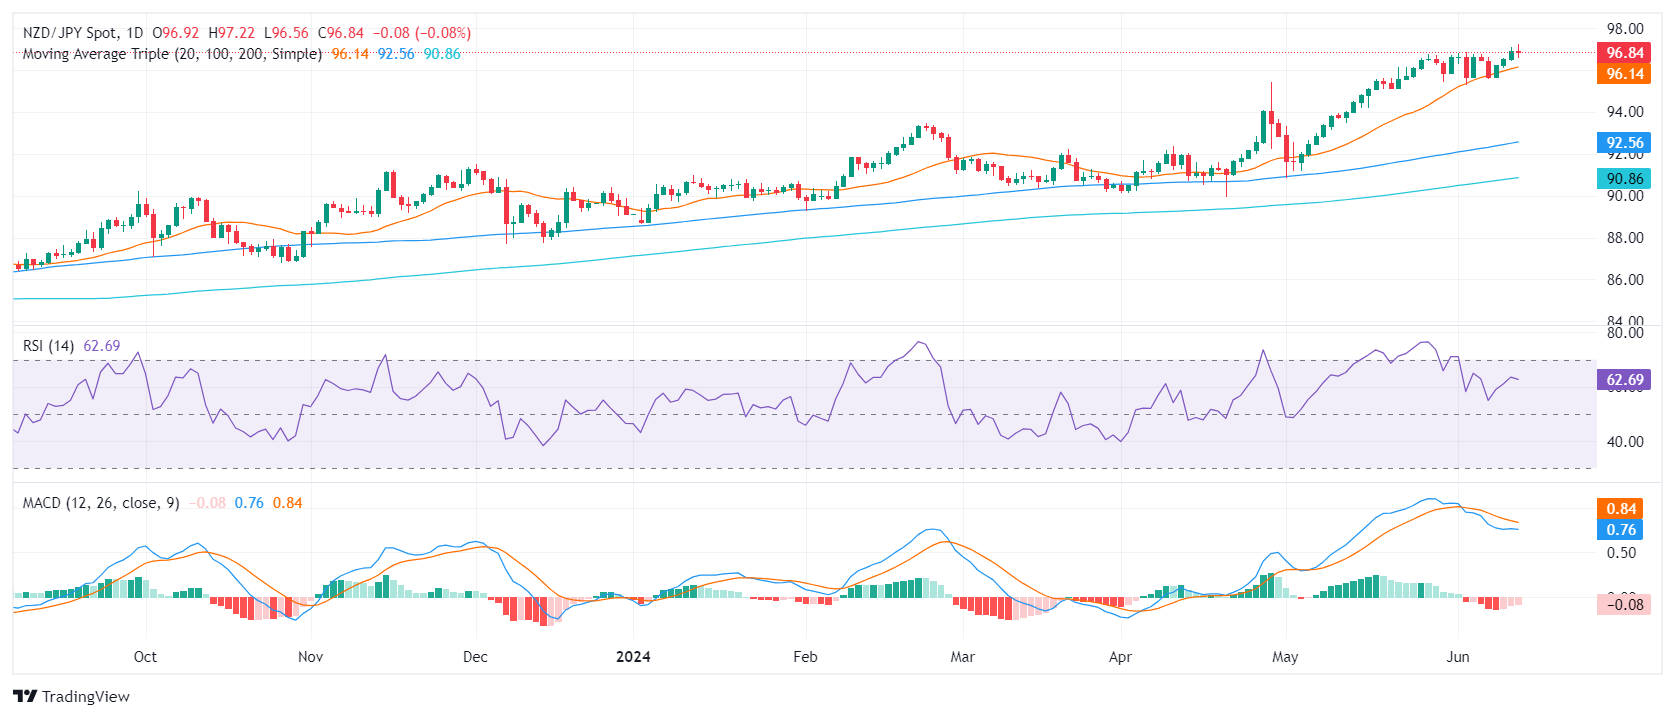 The continuous presence of buyers above the 20-day Simple Moving Average (SMA) indicates their effort to sustain the bullish push. Yet, the recent exhaustion signal demonstrated by the daily technical indicators supports the market's need to consolidate following the significant surge recorded in May. The upcoming trading sessions might see the pair oscillate between the 95.00 level, serving as support, and the 97.00 level, acting as resistance, as the pair looks to stabilize after recent gains.
The longer-term SMAs established around 90.00 - 92.00 safeguard the overall bullish complexion of the pair.


© 2000-2026. All rights reserved.
This site is managed by Teletrade D.J. LLC 2351 LLC 2022 (Euro House, Richmond Hill Road, Kingstown, VC0100, St. Vincent and the Grenadines).
The information on this website is for informational purposes only and does not constitute any investment advice.
The company does not serve or provide services to customers who are residents of the US, Canada, Iran, The Democratic People's Republic of Korea, Yemen and FATF blacklisted countries.
Making transactions on financial markets with marginal financial instruments opens up wide possibilities and allows investors who are willing to take risks to earn high profits, carrying a potentially high risk of losses at the same time. Therefore you should responsibly approach the issue of choosing the appropriate investment strategy, taking the available resources into account, before starting trading.
Use of the information: full or partial use of materials from this website must always be referenced to TeleTrade as the source of information. Use of the materials on the Internet must be accompanied by a hyperlink to teletrade.org. Automatic import of materials and information from this website is prohibited.
Please contact our PR department if you have any questions or need assistance at pr@teletrade.global.
transfers