- Analytics
- News and Tools
- Market News
- GBP/USD clears some gains after Fed's decision and dot plot revision
GBP/USD clears some gains after Fed's decision and dot plot revision
- Fed holds rates steady at 5.25%-5.50% as expected.
- Dot plot indicates that most FOMC members are seeing fewer rate cuts this year.
- As an initial reaction, the USD recovered and the pair cleared some of its daily losses.
On Wednesday, the GBP/USD cleared some of its gains following the Federal Reserve (Fed) decision to hold rates steady at 5.25%-5.50% and stands at 1.2830. What strengthened the USD is that the dot plot suggested that the members are seeing two instead of three rate cuts in 2024.
Regarding economic protections, the bank revised its Personal Consumption Expenditures (PCE) forecasts to 2.4% YoY from 2.6% YoY, while growth protections remain unchanged. The interest protections, via the so-called dot plot, showed an upward revision of the interest rates by the end of 2024 now at 5.1%, up from 4.6%, and for the 2025 at 4.1%, up from 3.9%. The projection for 2026 stood at 3.1%, and the longer-run rate has been revised to 2.8% from 2.6%.
As a reaction, the USD recovered some ground following the soft Consumer Price Index (CPI) figures from May, which triggered a sharp decline in US Treasury bond yields earlier in the session. The US 2, 5 and 10-year rates cleared some losses but are still down by more than 2%.
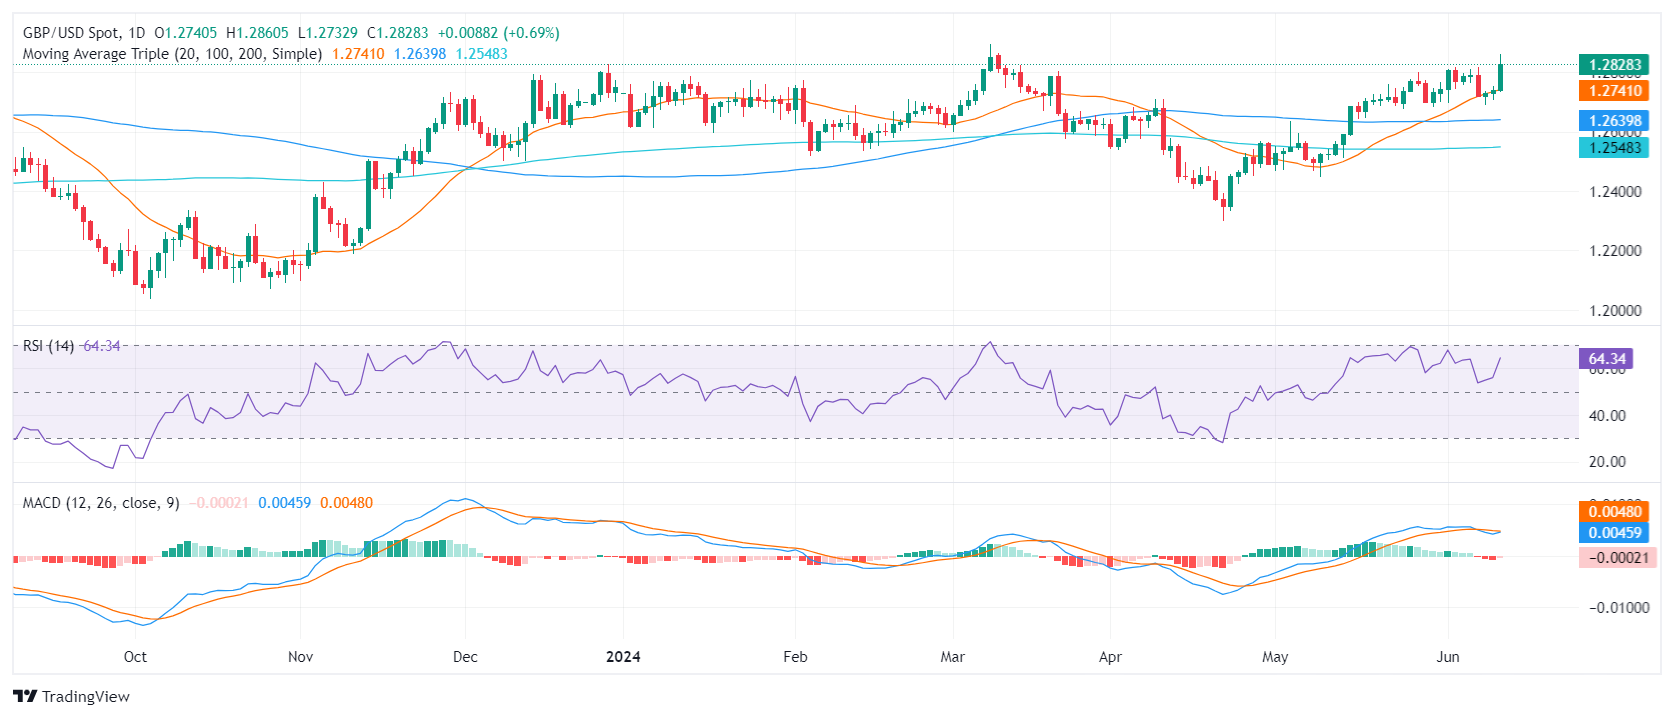
GBP/USD technical analysis
Indicators on the daily chart significantly recovered and remain deep in positive terrain. The Relative Strength Index (RSI) moved toward 60, while the Moving Average Convergence Divergence (MACD) prints decreasing red bars, indicating a decreasing selling pressure. The overall outlook remains positive as the pair rides above the 20, 100 and 200-day Simple Moving Averages (SMA).


© 2000-2026. All rights reserved.
This site is managed by Teletrade D.J. LLC 2351 LLC 2022 (Euro House, Richmond Hill Road, Kingstown, VC0100, St. Vincent and the Grenadines).
The information on this website is for informational purposes only and does not constitute any investment advice.
The company does not serve or provide services to customers who are residents of the US, Canada, Iran, The Democratic People's Republic of Korea, Yemen and FATF blacklisted countries.
Making transactions on financial markets with marginal financial instruments opens up wide possibilities and allows investors who are willing to take risks to earn high profits, carrying a potentially high risk of losses at the same time. Therefore you should responsibly approach the issue of choosing the appropriate investment strategy, taking the available resources into account, before starting trading.
Use of the information: full or partial use of materials from this website must always be referenced to TeleTrade as the source of information. Use of the materials on the Internet must be accompanied by a hyperlink to teletrade.org. Automatic import of materials and information from this website is prohibited.
Please contact our PR department if you have any questions or need assistance at pr@teletrade.global.
transfers