- Analytics
- News and Tools
- Market News
- Silver Price Forecast: $30.0 appears a tough nut to crack for XAG/USD
Silver Price Forecast: $30.0 appears a tough nut to crack for XAG/USD
- Silver price edges higher near $29.40 Wednesday’s Asian session, up 0.40% on the day.
- The negative stance of Silver remains intact below the 100-period EMA, with a bearish RSI indicator.
- The crucial resistance level is seen at the $30.0 psychological mark; the initial support level is located at $29.04.
The Silver price (XAG/USD) recovers to $29.40 on Wednesday despite the stronger Greenback. However, the upside for white metal might be limited by the speculation of delayed rate cuts by the US Federal Reserve (Fed). The market could turn cautious later in the day ahead of the release of the US Consumer Price Index (CPI) and the Fed interest rate decision.
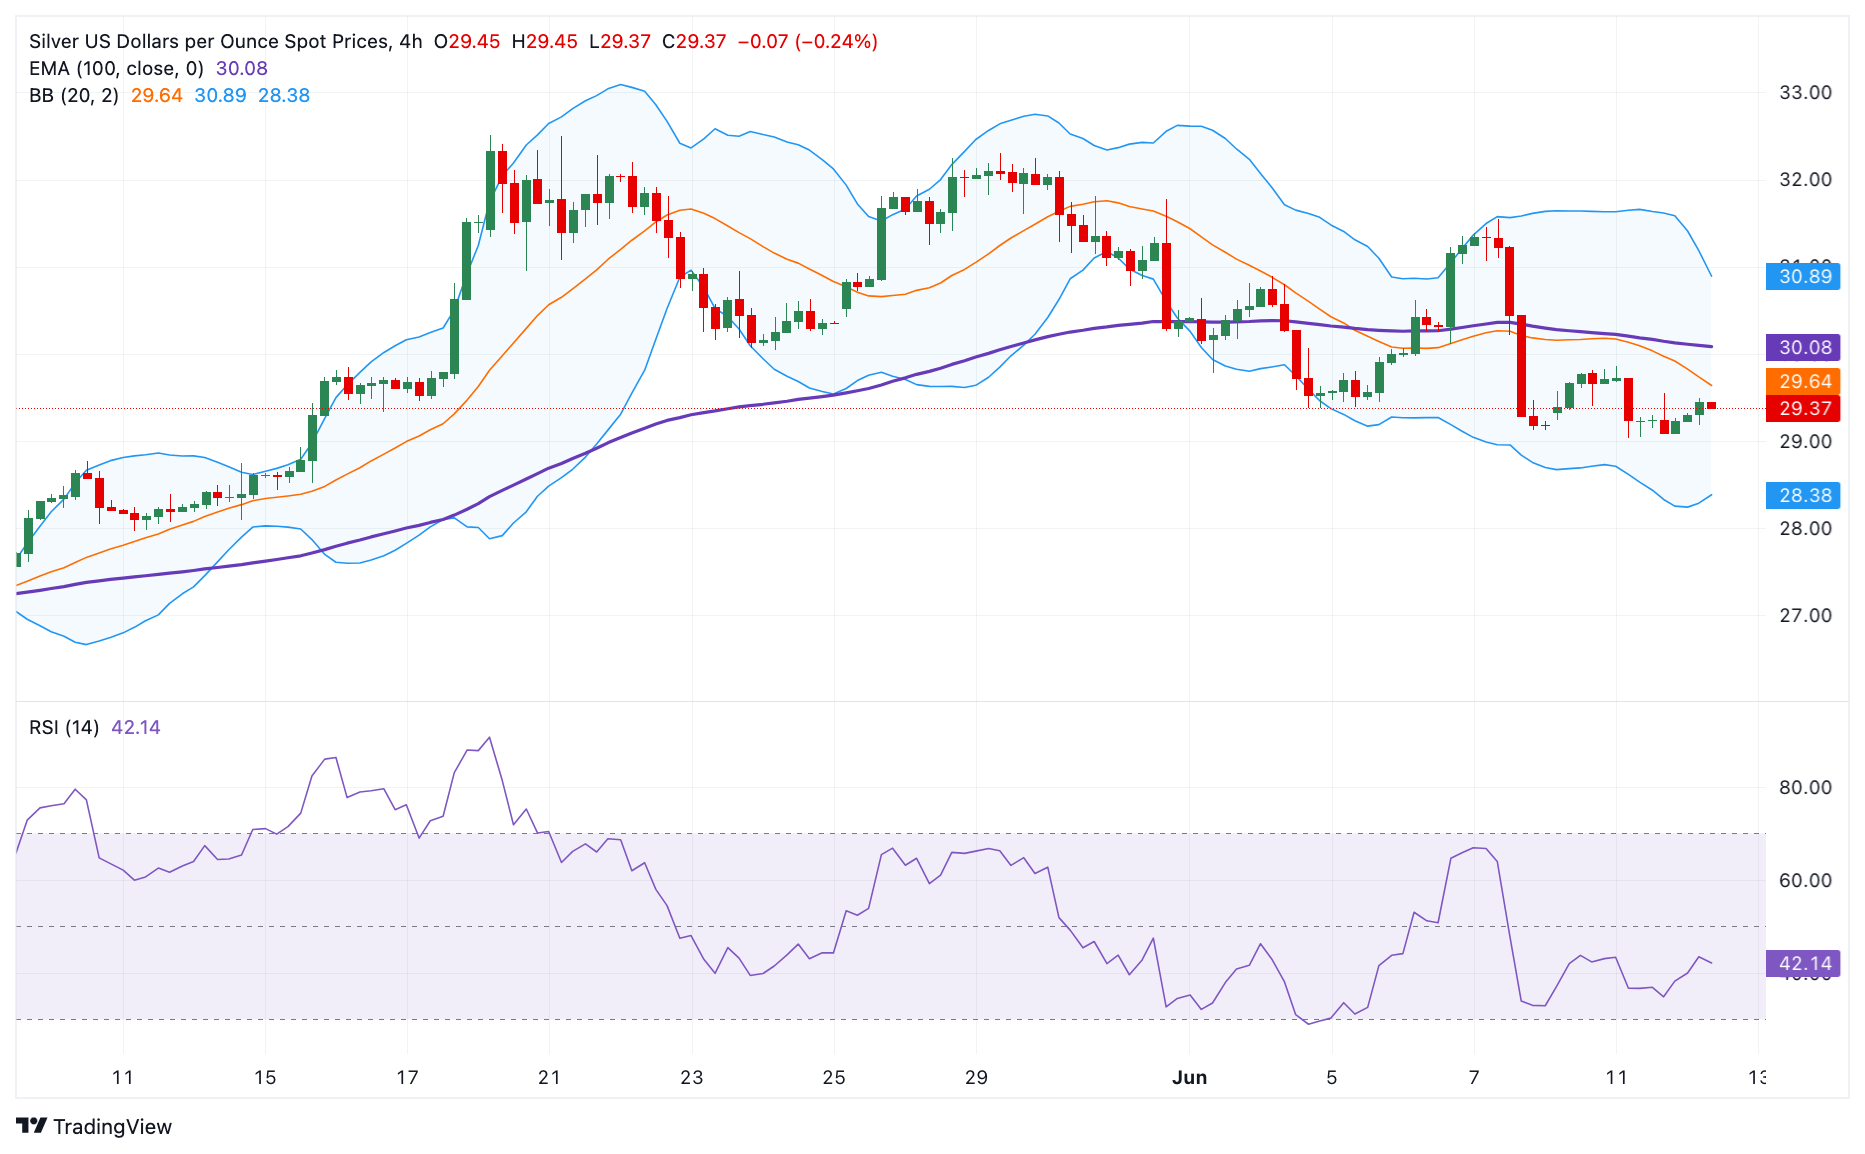
Technically, Silver keeps the bearish vibe unchanged on the 4-hour chart as the white metal holds below the key 100-period Exponential Moving Average (EMA). Furthermore, the downward momentum is supported by the Relative Strength Index (RSI), which stands in the bearish zone near 43.0, suggesting the path of least resistance is to the downside.
The key upside barrier for silver will emerge at $30.0, the psychological mark and 100-period EMA. A decisive break above the latter will see a rally to $30.90, the upper boundary of the Bollinger Band. The additional upside filter to watch is a high of June 7 at $31.55, and finally a high of May 29 at $32.31.
On the flip side, a low of June 11 at $29.04 acts as an initial support level for XAG/USD. Any follow-through selling below this level will see a drop to the lower limit of the Bollinger Band at $28.40. Further south, the next contention level is located at the $28.00 round figure.
Silver (XAG/USD) 4-hour chart


© 2000-2026. All rights reserved.
This site is managed by Teletrade D.J. LLC 2351 LLC 2022 (Euro House, Richmond Hill Road, Kingstown, VC0100, St. Vincent and the Grenadines).
The information on this website is for informational purposes only and does not constitute any investment advice.
The company does not serve or provide services to customers who are residents of the US, Canada, Iran, The Democratic People's Republic of Korea, Yemen and FATF blacklisted countries.
Making transactions on financial markets with marginal financial instruments opens up wide possibilities and allows investors who are willing to take risks to earn high profits, carrying a potentially high risk of losses at the same time. Therefore you should responsibly approach the issue of choosing the appropriate investment strategy, taking the available resources into account, before starting trading.
Use of the information: full or partial use of materials from this website must always be referenced to TeleTrade as the source of information. Use of the materials on the Internet must be accompanied by a hyperlink to teletrade.org. Automatic import of materials and information from this website is prohibited.
Please contact our PR department if you have any questions or need assistance at pr@teletrade.global.
transfers