- Analytics
- News and Tools
- Market News
- AUD/JPY Price Analysis: Positive momentum stirs, 103.00 supports hold firm
AUD/JPY Price Analysis: Positive momentum stirs, 103.00 supports hold firm
- Daily chart indicators reveal a slight recovery from the latest bearish movements of the pair.
- Signs of a bullish pivot are emerging, intimating a potential decrease in bearish pressure or a hiccup in the consolidation phase.
- The pair contacts the crucial 20-day SMA at 103.90, which recently began to act as a resistance.
On Monday, the AUD/JPY pair showed signs of stabilizing and rebounded to 103.80, near the 20-day Simple Moving Average (SMA). This could indicate a potential easing of the downward momentum that followed last week's consolidation phase.
Turning attention to the daily Relative Strength Index (RSI) analysis, the index currently stands at 52. Compared to earlier readings, a notable increase suggests the pair's momentum may have taken a bullish turn in the near term. Furthermore, the Moving Average Convergence Divergence (MACD) continues to chart flat red bars, indicating a flattening negative momentum.
AUD/JPY daily chart
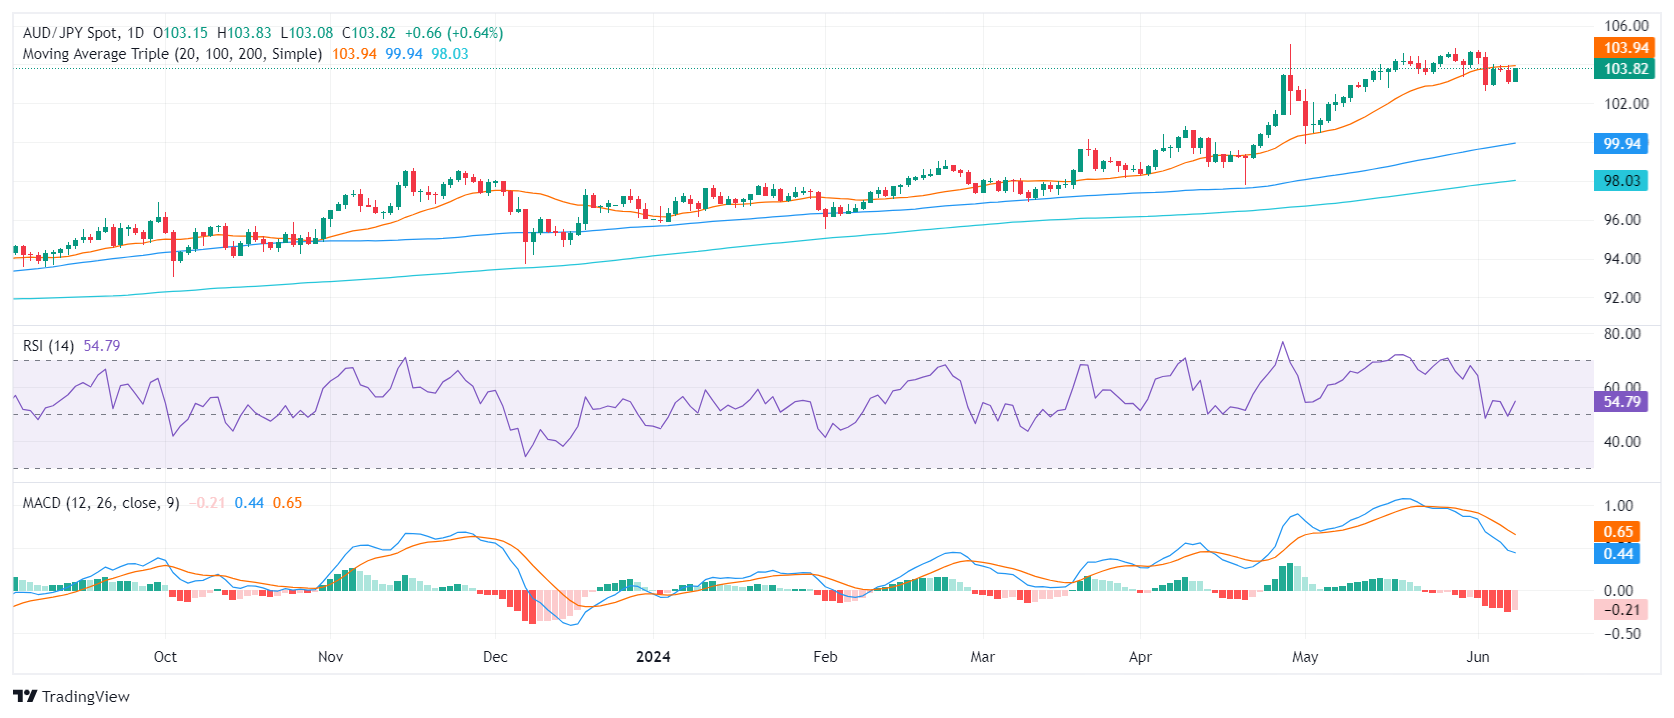
If the pair succumbs to further losses, the 100 and 200-day SMAs provide solid support platforms at around 99.80 and 97.98 respectively. If a bullish reaction propels the pair above the currently challenging 20-day SMA at 103.90, and towards the 105.00 level, significant resistance is to be expected. However, if these resistance barriers hold firm, the AUD/JPY pair may prolong its consolidation stage.
In conclusion, the AUD/JPY pair has encountered strong support at 103.00, indicated by its recent recovery to 103.80 on Monday. This could suggest a potential easing of the bearish pressure unless the pair is able to break through the 20-day SMA of 103.90.


© 2000-2026. All rights reserved.
This site is managed by Teletrade D.J. LLC 2351 LLC 2022 (Euro House, Richmond Hill Road, Kingstown, VC0100, St. Vincent and the Grenadines).
The information on this website is for informational purposes only and does not constitute any investment advice.
The company does not serve or provide services to customers who are residents of the US, Canada, Iran, The Democratic People's Republic of Korea, Yemen and FATF blacklisted countries.
Making transactions on financial markets with marginal financial instruments opens up wide possibilities and allows investors who are willing to take risks to earn high profits, carrying a potentially high risk of losses at the same time. Therefore you should responsibly approach the issue of choosing the appropriate investment strategy, taking the available resources into account, before starting trading.
Use of the information: full or partial use of materials from this website must always be referenced to TeleTrade as the source of information. Use of the materials on the Internet must be accompanied by a hyperlink to teletrade.org. Automatic import of materials and information from this website is prohibited.
Please contact our PR department if you have any questions or need assistance at pr@teletrade.global.
transfers