- Analytics
- News and Tools
- Market News
- GBP/USD Price Analysis: Consolidates around 1.2700 after hitting 7-day low
GBP/USD Price Analysis: Consolidates around 1.2700 after hitting 7-day low
- GBP/USD slightly down for the second session in a row.
- Technicals indicate losing buyer momentum as RSI approaches the 50-midline.
- A drop below 1.2700 could push GBP/USD towards key moving averages near 1.2686 and potentially lower.
- Upside seen above 1.2750, with buyers eyeing 1.2800.
The British Pound extended its losses for the second consecutive trading session against the US Dollar, following last Friday’s stellar jobs report from the US, which triggered the likelihood of a less dovish Federal Reserve. That and uncertainty on the upcoming Fed’s meeting would keep Cable pressured. Therefore, the GBP/USD trades at 1.2713, down 0.01%
GBP/USD Price Analysis: Technical outlook
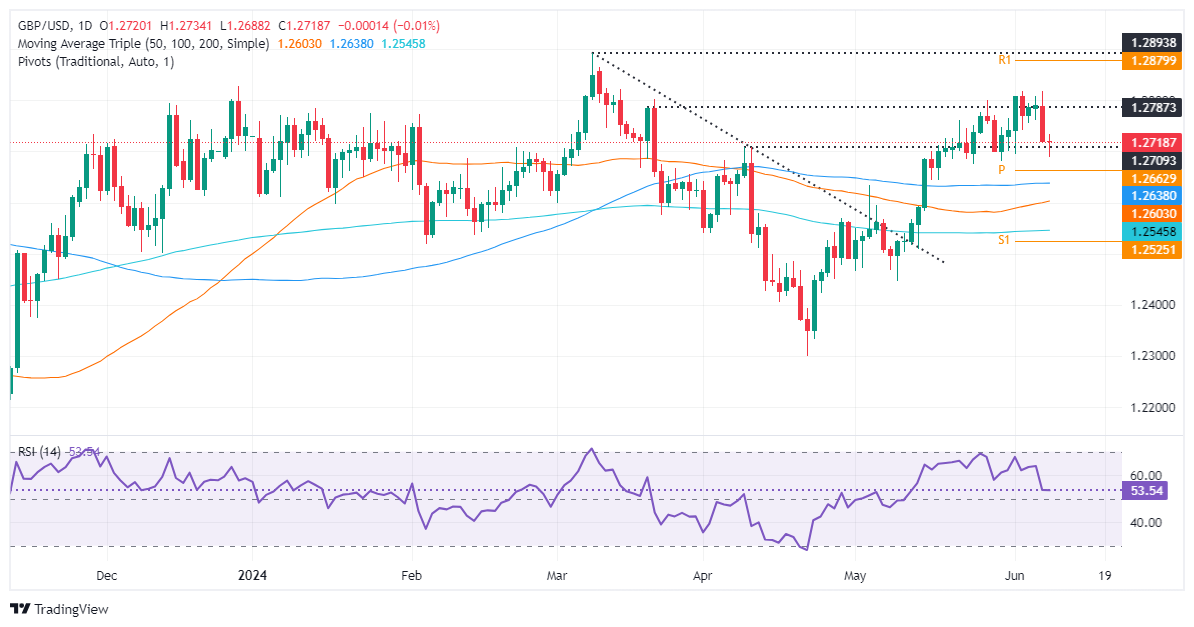
After struggling at around 1.2800 with key technical resistance levels, the GBP/USD tumbled below 1.2700 and printed a new seven-day low of 1.2687 before recovering some ground.
Although momentum still favors buyers, the Relative Strength Index (RSI) dropped sharply towards crossing the 50-midline, hinting that buyers are losing momentum. Nevertheless, Monday’s price action seems to form a ‘dragonfly doji,’ a bullish candlestick.
If GBP/USD reclaims 1.2750, it will be possible to challenge the June 7 high of 1.2813. Once cleared, the next resistance line will be 1.2850, followed by 1.2900.
Conversely, if GBP/USD prints a daily close below 1.2700, that would sponsor a leg-down toward the confluence of the 100-day moving average (DMA) at around 1.2686, ahead of the 50 and 200-DMAs each at 1.2602 and 1.2543, respectively.
GBP/USD Price Action – Daily Chart


© 2000-2026. All rights reserved.
This site is managed by Teletrade D.J. LLC 2351 LLC 2022 (Euro House, Richmond Hill Road, Kingstown, VC0100, St. Vincent and the Grenadines).
The information on this website is for informational purposes only and does not constitute any investment advice.
The company does not serve or provide services to customers who are residents of the US, Canada, Iran, The Democratic People's Republic of Korea, Yemen and FATF blacklisted countries.
Making transactions on financial markets with marginal financial instruments opens up wide possibilities and allows investors who are willing to take risks to earn high profits, carrying a potentially high risk of losses at the same time. Therefore you should responsibly approach the issue of choosing the appropriate investment strategy, taking the available resources into account, before starting trading.
Use of the information: full or partial use of materials from this website must always be referenced to TeleTrade as the source of information. Use of the materials on the Internet must be accompanied by a hyperlink to teletrade.org. Automatic import of materials and information from this website is prohibited.
Please contact our PR department if you have any questions or need assistance at pr@teletrade.global.
transfers