- Analytics
- News and Tools
- Market News
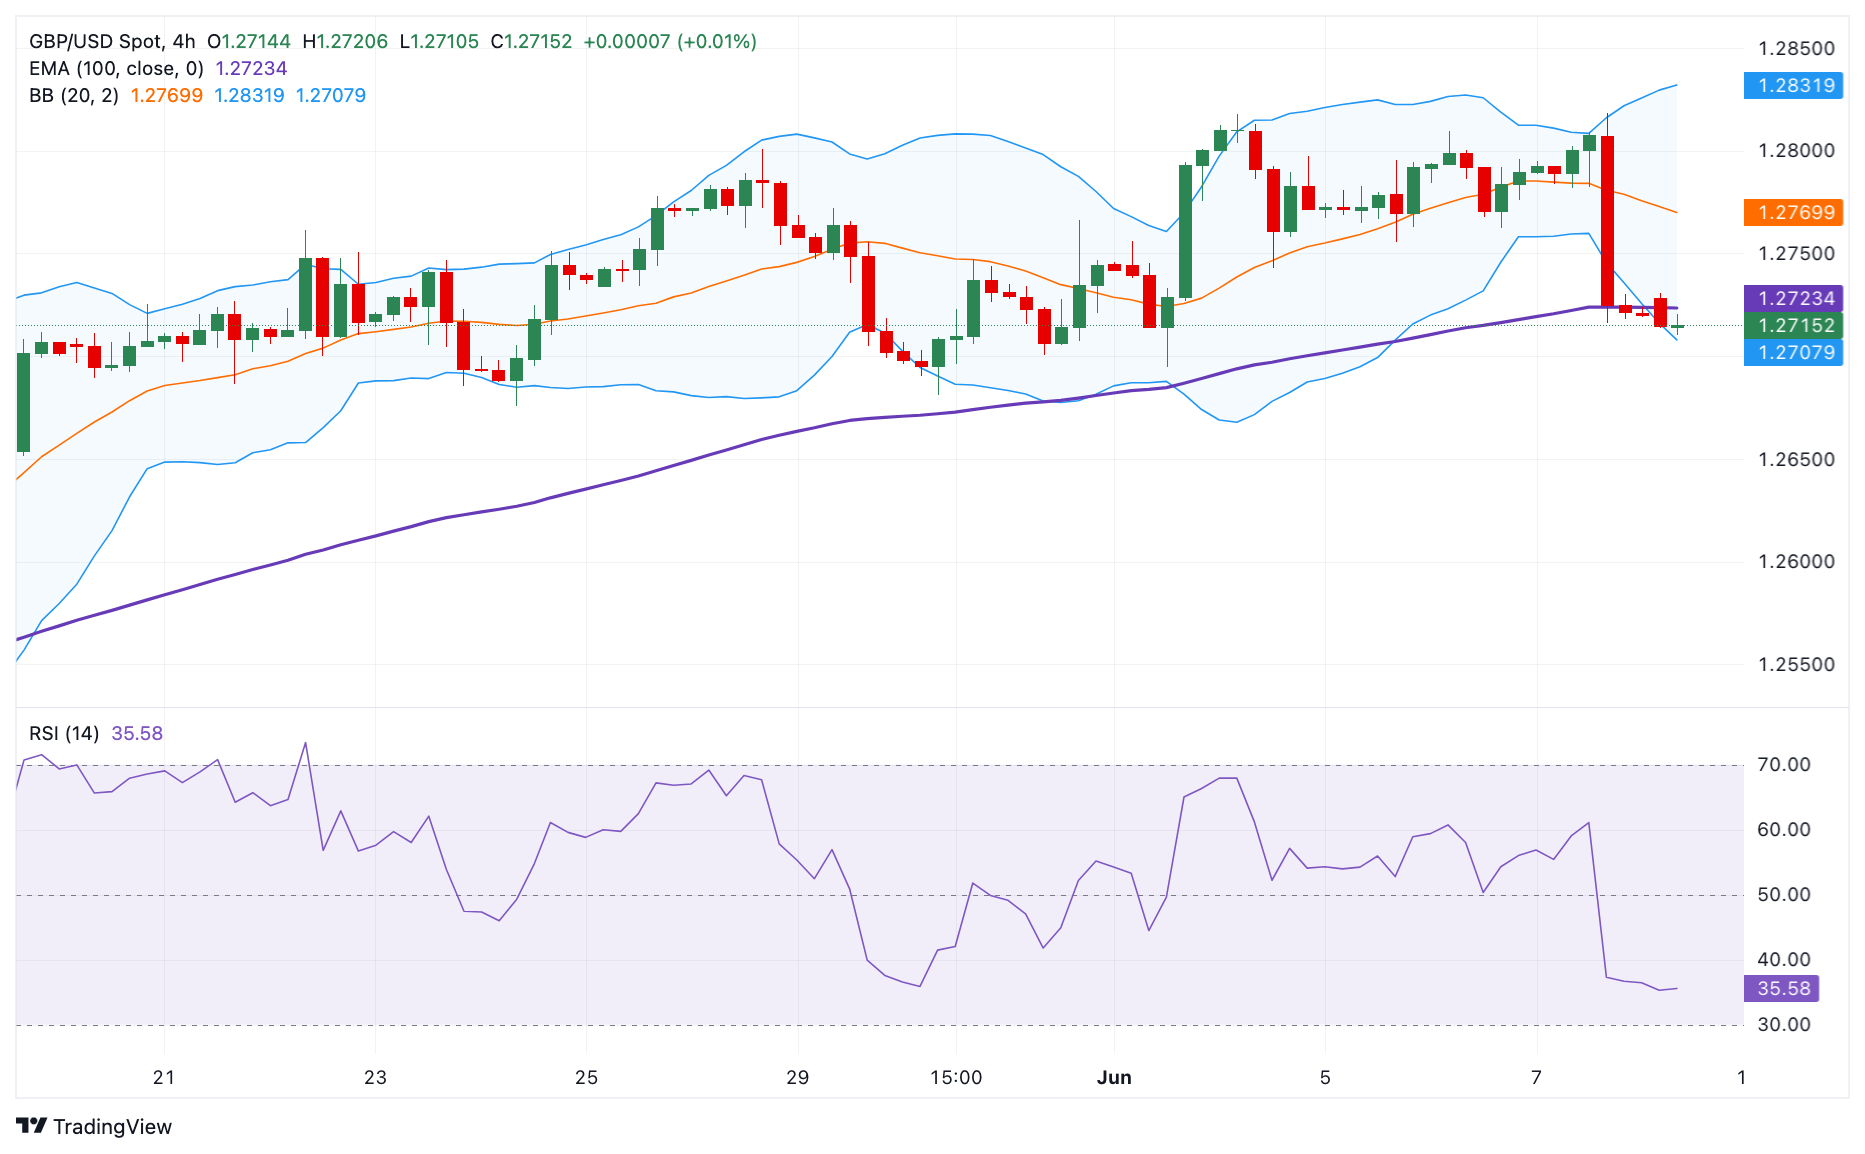
- GBP/USD Price Analysis: The potential support level is located above 1.2700
GBP/USD Price Analysis: The potential support level is located above 1.2700
- GBP/USD struggles to gain ground around 1.2715 in Monday’s early European session.
- The pair keeps the negative vibe below the 100-period EMA, with bearish RSI indicator on the 4-hour chart.
- The first downside target is seen in the 1.2700–1.2701 zone; the next upside barrier is located at 1.2795.
The GBP/USD pair trades in negative territory for the second consecutive day near 1.2715 during the early European session on Monday. The stronger US Dollar (USD) broadly drags the major pair lower. Investors await the UK Employment data on Tuesday for fresh impetus, including Claimant Count Change, Employment Change, and Average Earnings data. Any evidence of more layoffs in the UK economy might trigger the expectations of early rate cuts from the Bank of England (BoE) and might weigh on the Pound Sterling (GBP).
According to the 4-hour chart, the outlook of GBP/USD turns bearish as it holds below the key 100-period Exponential Moving Average (EMA). The downward momentum is supported by the Relative Strength Index (RSI), which stands around 37.00, indicating the path of least resistance is to the downside.
A decisive break below the lower limit of the Bollinger Band and psychological level at the 1.2700-1.2710 region will pave the way to 1.2681, a low of May 30. Further south, the next contention level is seen at 1.2645, a low of May 17, followed by the 1.2600 round mark.
The major pair should resume the upside if it crosses above the 100-period EMA at 1.2723. The next upside barrier for GBP/USD will emerge at 1.2795, a low of June 5. Any follow-through buying will expose 1.2809, a high of June 6, and finally the upper boundary of the Bollinger Band at 1.2831.
GBP/USD 4-hour chart


© 2000-2026. All rights reserved.
This site is managed by Teletrade D.J. LLC 2351 LLC 2022 (Euro House, Richmond Hill Road, Kingstown, VC0100, St. Vincent and the Grenadines).
The information on this website is for informational purposes only and does not constitute any investment advice.
The company does not serve or provide services to customers who are residents of the US, Canada, Iran, The Democratic People's Republic of Korea, Yemen and FATF blacklisted countries.
Making transactions on financial markets with marginal financial instruments opens up wide possibilities and allows investors who are willing to take risks to earn high profits, carrying a potentially high risk of losses at the same time. Therefore you should responsibly approach the issue of choosing the appropriate investment strategy, taking the available resources into account, before starting trading.
Use of the information: full or partial use of materials from this website must always be referenced to TeleTrade as the source of information. Use of the materials on the Internet must be accompanied by a hyperlink to teletrade.org. Automatic import of materials and information from this website is prohibited.
Please contact our PR department if you have any questions or need assistance at pr@teletrade.global.
transfers