- Analytics
- News and Tools
- Market News
- AUD/JPY Price Analysis: Consolidation phase continues, bearish pressure observed
AUD/JPY Price Analysis: Consolidation phase continues, bearish pressure observed
- Daily chart indicators reveal a neutral period for the pair; RSI stands at 49, showcasing no strong directional bias.
- Signs of a bearish takeover are emerging, suggesting possible short-term bearish pressure or further consolidation.
- The pair now interacts with the important 20-day SMA at 103.90, which currently serves as resistance to recover.
During the last trading sessions of this week, the AUD/JPY pair is maneuvering around the 103.00 level. This is indicative of an ongoing consolidation period following the impressive rally since early May.
Shifting the attention to the daily Relative Strength Index (RSI) analysis, the index is sitting at 49. When compared to the previous readings, a clear decline suggests that the pair has entered a bearish momentum in the short term. Moreover, the Moving Average Convergence Divergence (MACD) has started printing flat red bars, signaling that the market is experiencing steady selling activity.
AUD/JPY daily chart
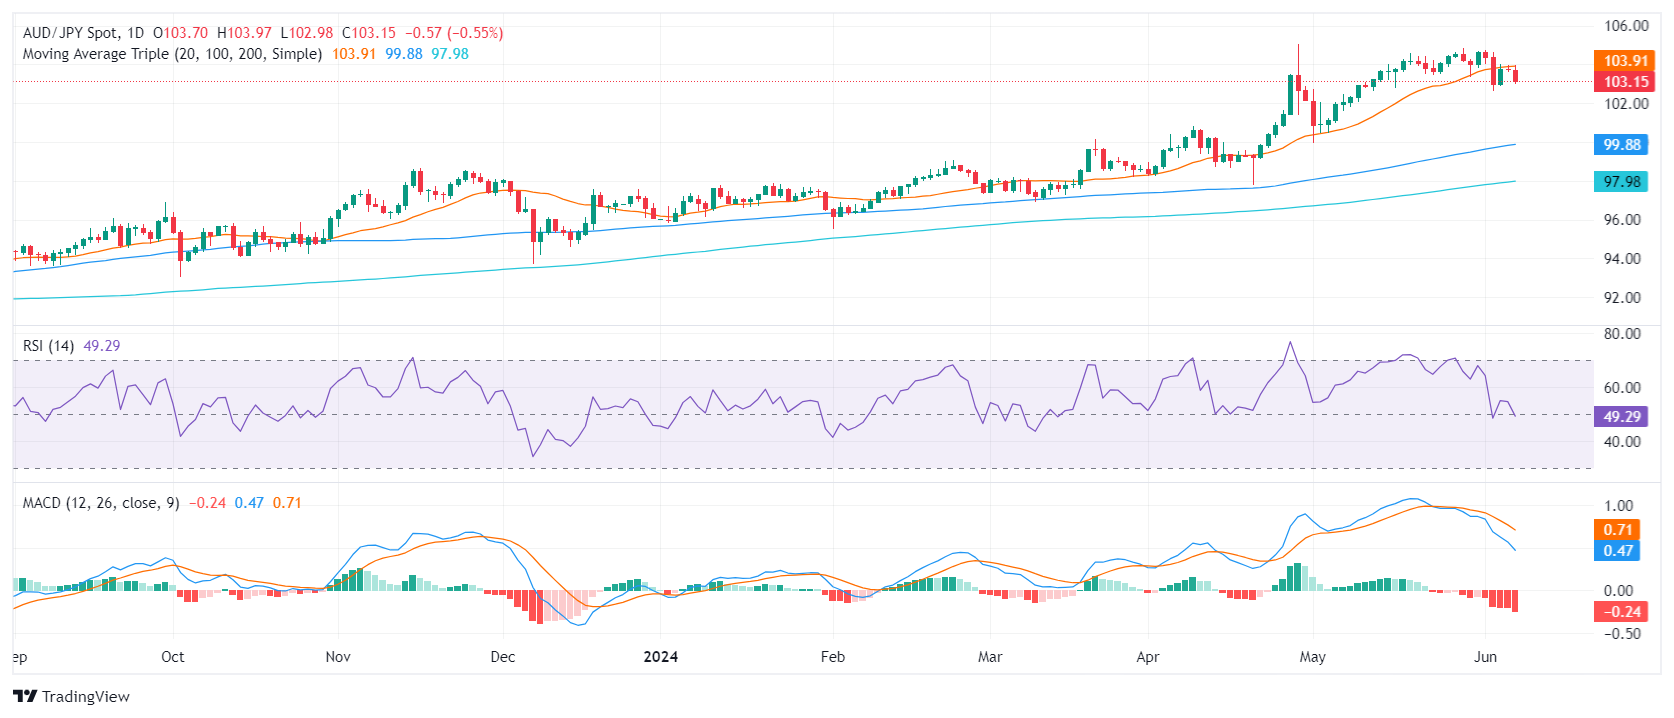
Should the pair suffer further losses, the 100 and 200-day SMAs are readily available as buffering units. These averages are situated at about 99.80 and 97.98, respectively. Conversely, any attempt by the bulls to push the pair above the aforementioned 20-day SMA and further to the 105.00 level will be met with resistance. If these resistance barriers remain unbroken, the AUD/JPY pair might extend its consolidation phase.


© 2000-2026. All rights reserved.
This site is managed by Teletrade D.J. LLC 2351 LLC 2022 (Euro House, Richmond Hill Road, Kingstown, VC0100, St. Vincent and the Grenadines).
The information on this website is for informational purposes only and does not constitute any investment advice.
The company does not serve or provide services to customers who are residents of the US, Canada, Iran, The Democratic People's Republic of Korea, Yemen and FATF blacklisted countries.
Making transactions on financial markets with marginal financial instruments opens up wide possibilities and allows investors who are willing to take risks to earn high profits, carrying a potentially high risk of losses at the same time. Therefore you should responsibly approach the issue of choosing the appropriate investment strategy, taking the available resources into account, before starting trading.
Use of the information: full or partial use of materials from this website must always be referenced to TeleTrade as the source of information. Use of the materials on the Internet must be accompanied by a hyperlink to teletrade.org. Automatic import of materials and information from this website is prohibited.
Please contact our PR department if you have any questions or need assistance at pr@teletrade.global.
transfers