- Analytics
- News and Tools
- Market News
- EUR/JPY Price Analysis: Bulls fight to hold the 20-day SMA, bears steady
EUR/JPY Price Analysis: Bulls fight to hold the 20-day SMA, bears steady
- The daily RSI records a balanced reading at 50, while the MACD bears a bearish crossover.
- The pair stabilize near the 20-day SMA, with buyers trying to avoid losses beneath it.
- The underlying bullish trend remains intact, guarded by the 100- and 200-day SMAs.
In Friday's session, the EUR/JPY pair is seen consolidating after a significant upward wave which took it near multi-year highs around 171.00, oscillating around the crucial 169.00 level. The stabilization at this junction is particularly corroborated by the proximity to the 20-day Simple Moving Average (SMA) near 169.60 which despite falling beneath, the cross will try to defend it as it serves as a strong support.
The Relative Strength Index (RSI) on the daily chart reads a steady 53 now, reflecting balanced market sentiment between the buyers and the sellers. This neutral RSI implies that the market participants are currently eagle-eyeing further direction before making a move. The daily Moving Average Convergence Divergence (MACD) has recently registered a bearish crossover- an occurrence when the MACD line dived under the signal line. This crossover potentially signals ensuing short-term bearish pressure, opening up possibilities of a tempo correction or further consolidation before resuming the upward march.
EUR/JPY daily chart
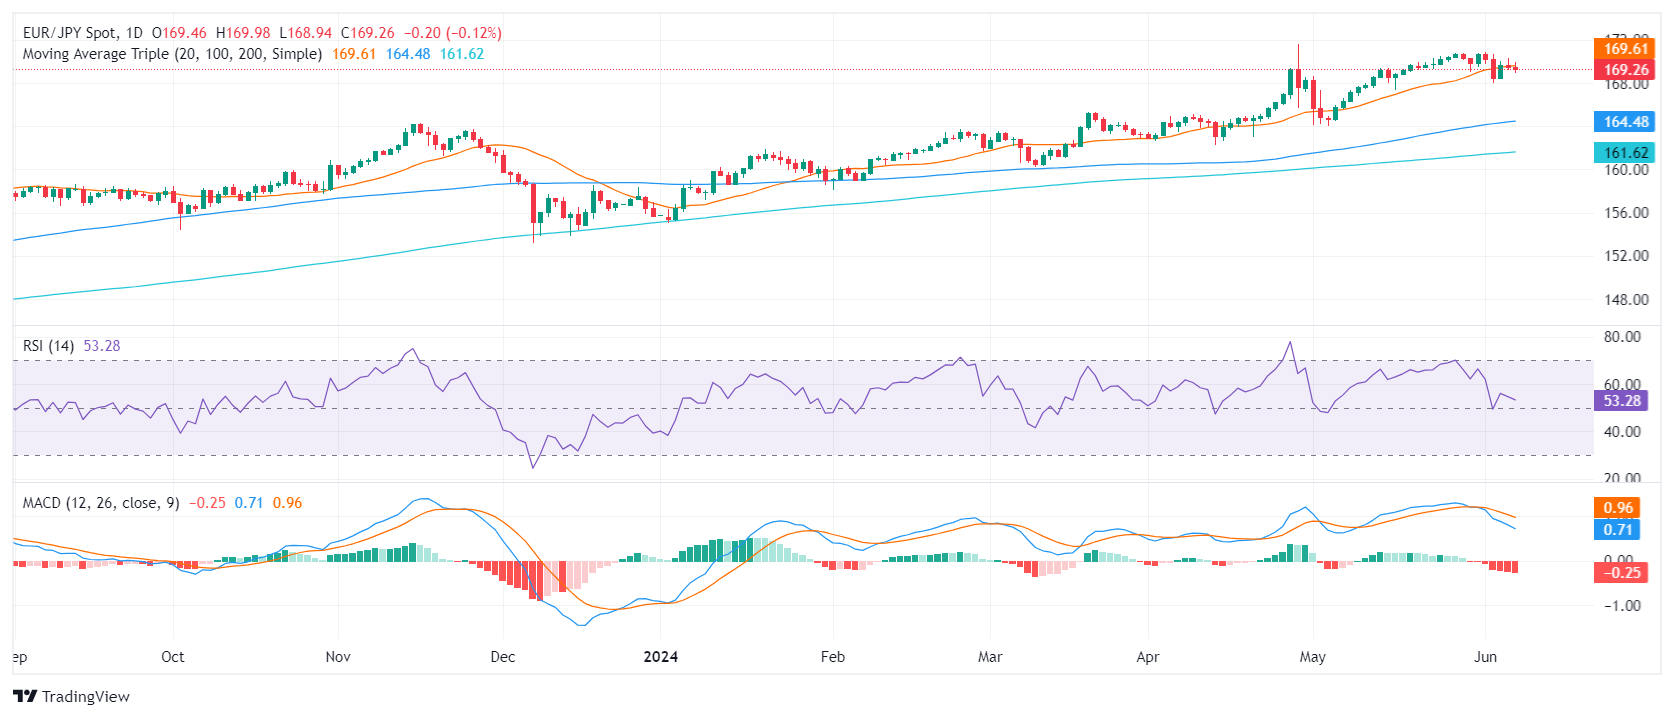
However, the broader bullish trend in the EUR/JPY remains unaffected. The support formed by the 100- and 200-day Simple Moving Averages (SMAs) at around 164.00 and 161.00, respectively, form a major bastion against long-drawn bearish movements. Therefore, while recent sessions brought some hope to bear, these movements should be treated as corrective rather than any structural changes in the trend.


© 2000-2026. All rights reserved.
This site is managed by Teletrade D.J. LLC 2351 LLC 2022 (Euro House, Richmond Hill Road, Kingstown, VC0100, St. Vincent and the Grenadines).
The information on this website is for informational purposes only and does not constitute any investment advice.
The company does not serve or provide services to customers who are residents of the US, Canada, Iran, The Democratic People's Republic of Korea, Yemen and FATF blacklisted countries.
Making transactions on financial markets with marginal financial instruments opens up wide possibilities and allows investors who are willing to take risks to earn high profits, carrying a potentially high risk of losses at the same time. Therefore you should responsibly approach the issue of choosing the appropriate investment strategy, taking the available resources into account, before starting trading.
Use of the information: full or partial use of materials from this website must always be referenced to TeleTrade as the source of information. Use of the materials on the Internet must be accompanied by a hyperlink to teletrade.org. Automatic import of materials and information from this website is prohibited.
Please contact our PR department if you have any questions or need assistance at pr@teletrade.global.
transfers