- Analytics
- News and Tools
- Market News
- EUR/USD Price Analysis: The first upside barrier is located above 1.0900
EUR/USD Price Analysis: The first upside barrier is located above 1.0900
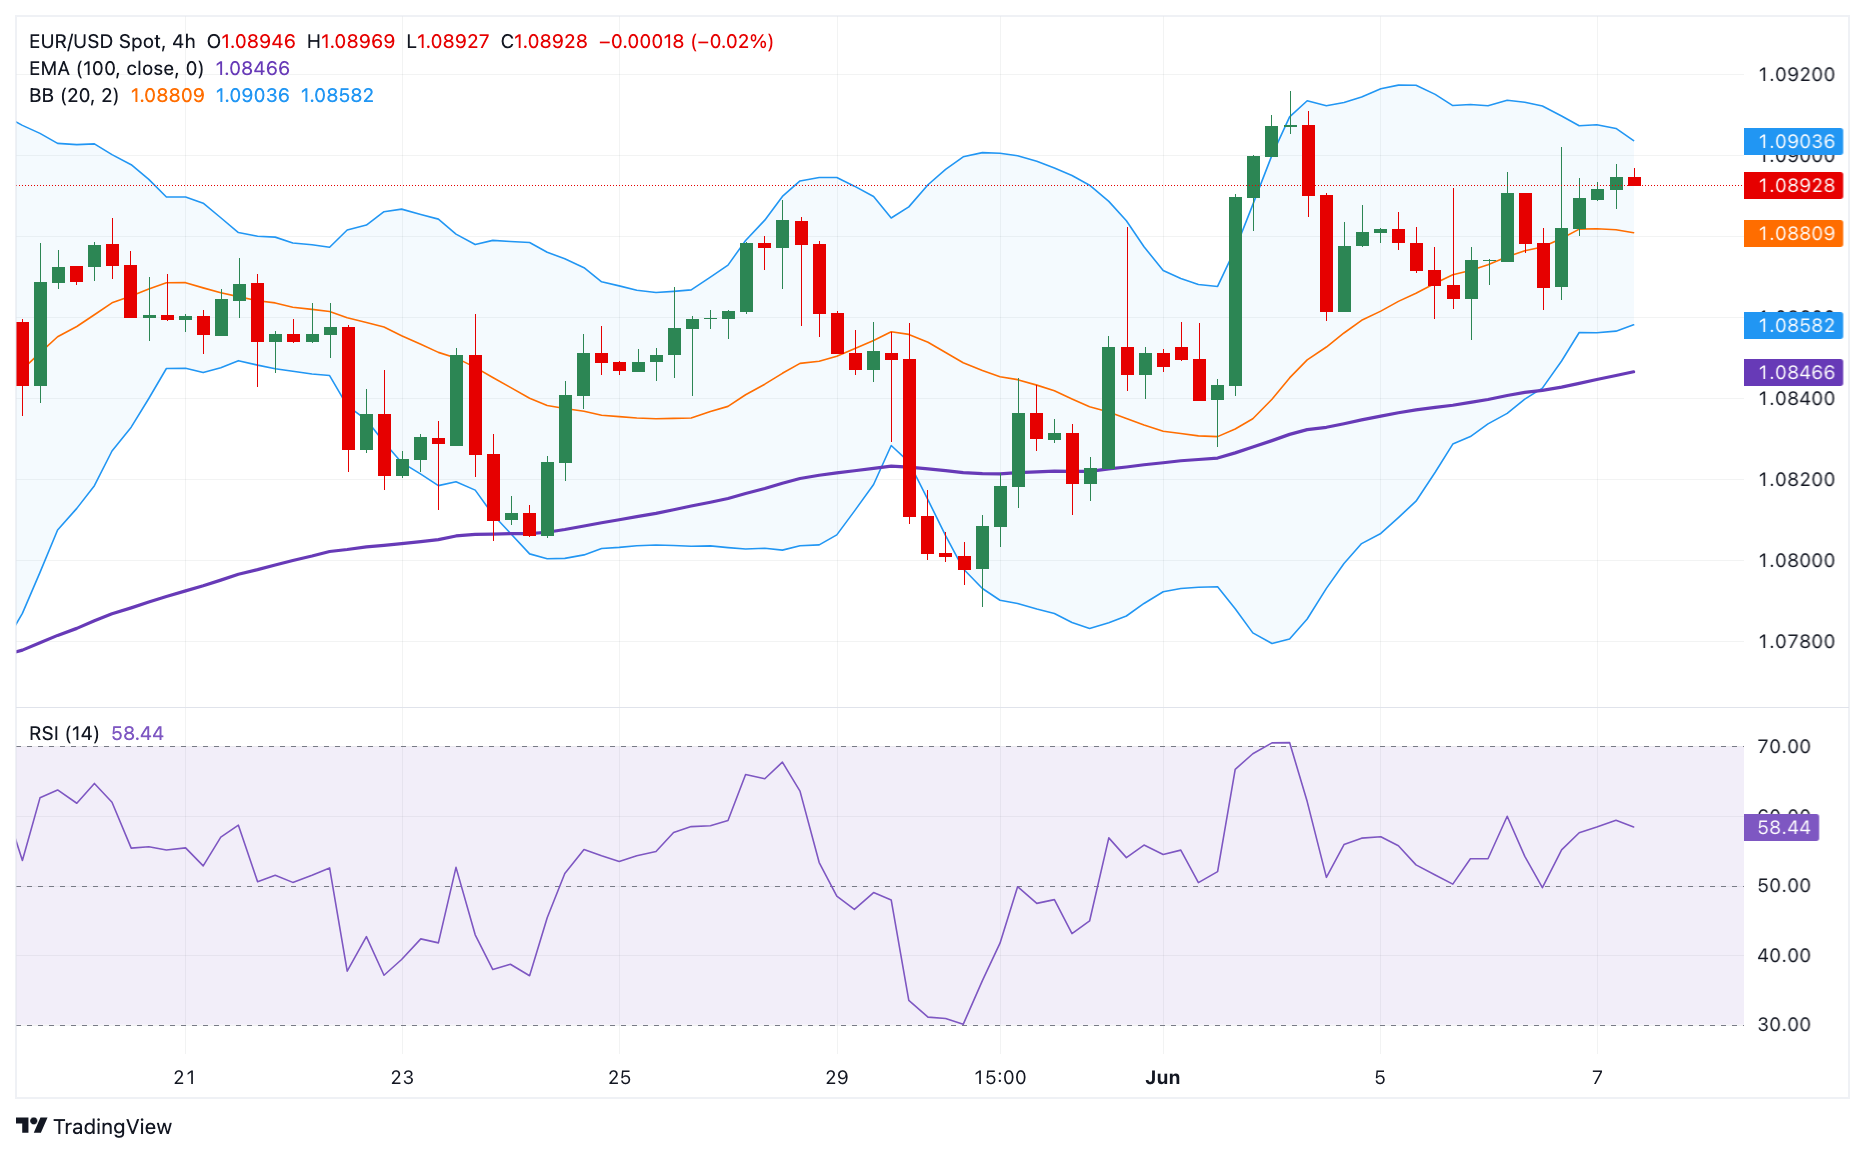
- EUR/USD holds positive ground near 1.0895 in Friday’s early European session.
- The pair maintains a positive stance on the 4-hour chart above the 100-period EMA, with a bullish RSI indicator.
- The first resistance level is seen in the 1.0900-1.0905 zone; the initial support level is located near 1.0860.
The EUR/USD pair trades in positive territory for the second consecutive day around 1.0895 during the early European session on Friday. The European Central Bank (ECB) decided to cut interest rates by 25 basis points (bps) at its June meeting on Thursday, as widely anticipated by markets. However, traders did not expect a July rate cut, and the rate differential between the Euro and USD is unlikely to widen as much as initial expectations. This, in turn, provides some support to the Euro against the Greenback.
From the technical perspective, EUR/USD keeps the bullish vibe unchanged on the 4-hour chart as the major pair holds above the key 100-period Exponential Moving Average (EMA). Additionally, the upward momentum is supported by the Relative Strength Index (RSI), which stands in the bullish zone near 60, suggesting the path of least resistance is to the upside.
The first upside barrier will emerge at the 1.0900-1.0905 region, representing the upper boundary of the Bollinger Band and psychological level. Further north, the next hurdle is seen near 1.0940, a high of March 21. The additional upside filter to watch is 1.0964 (high of March 13), followed by 1.0981 (high of March 8).
On the flip side, the initial support level for the pair is located around 1.0860, portraying the confluence of a low of June 6 and the lower limit of Bollinger Band. The next contention level to watch is the 100-period EMA at 1.0846. Any follow-through selling below this level will attract some sellers to 1.0811, a low of May 31.
EUR/USD 4-hour chart


© 2000-2026. All rights reserved.
This site is managed by Teletrade D.J. LLC 2351 LLC 2022 (Euro House, Richmond Hill Road, Kingstown, VC0100, St. Vincent and the Grenadines).
The information on this website is for informational purposes only and does not constitute any investment advice.
The company does not serve or provide services to customers who are residents of the US, Canada, Iran, The Democratic People's Republic of Korea, Yemen and FATF blacklisted countries.
Making transactions on financial markets with marginal financial instruments opens up wide possibilities and allows investors who are willing to take risks to earn high profits, carrying a potentially high risk of losses at the same time. Therefore you should responsibly approach the issue of choosing the appropriate investment strategy, taking the available resources into account, before starting trading.
Use of the information: full or partial use of materials from this website must always be referenced to TeleTrade as the source of information. Use of the materials on the Internet must be accompanied by a hyperlink to teletrade.org. Automatic import of materials and information from this website is prohibited.
Please contact our PR department if you have any questions or need assistance at pr@teletrade.global.
transfers