- Analytics
- News and Tools
- Market News
- EUR/JPY Price Analysis: Momentum shifts, bulls recover 20-day SMA
EUR/JPY Price Analysis: Momentum shifts, bulls recover 20-day SMA
- The daily RSI has shifted its course upwards, backed by the flat red bars on the MACD.
- Buyers stepped in to recover 20-Day SMA, shifting the short-term outlook from bearish to neutral.
- The underlying bullish trend is still safeguarded by the 100 and 200-day SMAs.
In Wednesday's session, the EUR/JPY pair witnessed a shift in momentum as buyers stepped in to recover the 20-day Simple Moving Average (SMA) at 169.40, supported by a recovery in the Yen against its peers. This bullish shift counters the bearish momentum from Tuesday's session as the pair emerges from local lows of 168.50.
The Relative Strength Index (RSI) on the daily chart has shown an upward shift from 48 to 54. This suggests an increase in buying momentum, potentially paving the way for a more substantial upside movement. The flat red bars on the daily Moving Average Convergence Divergence (MACD) further support this improving outlook.
EUR/JPY daily chart
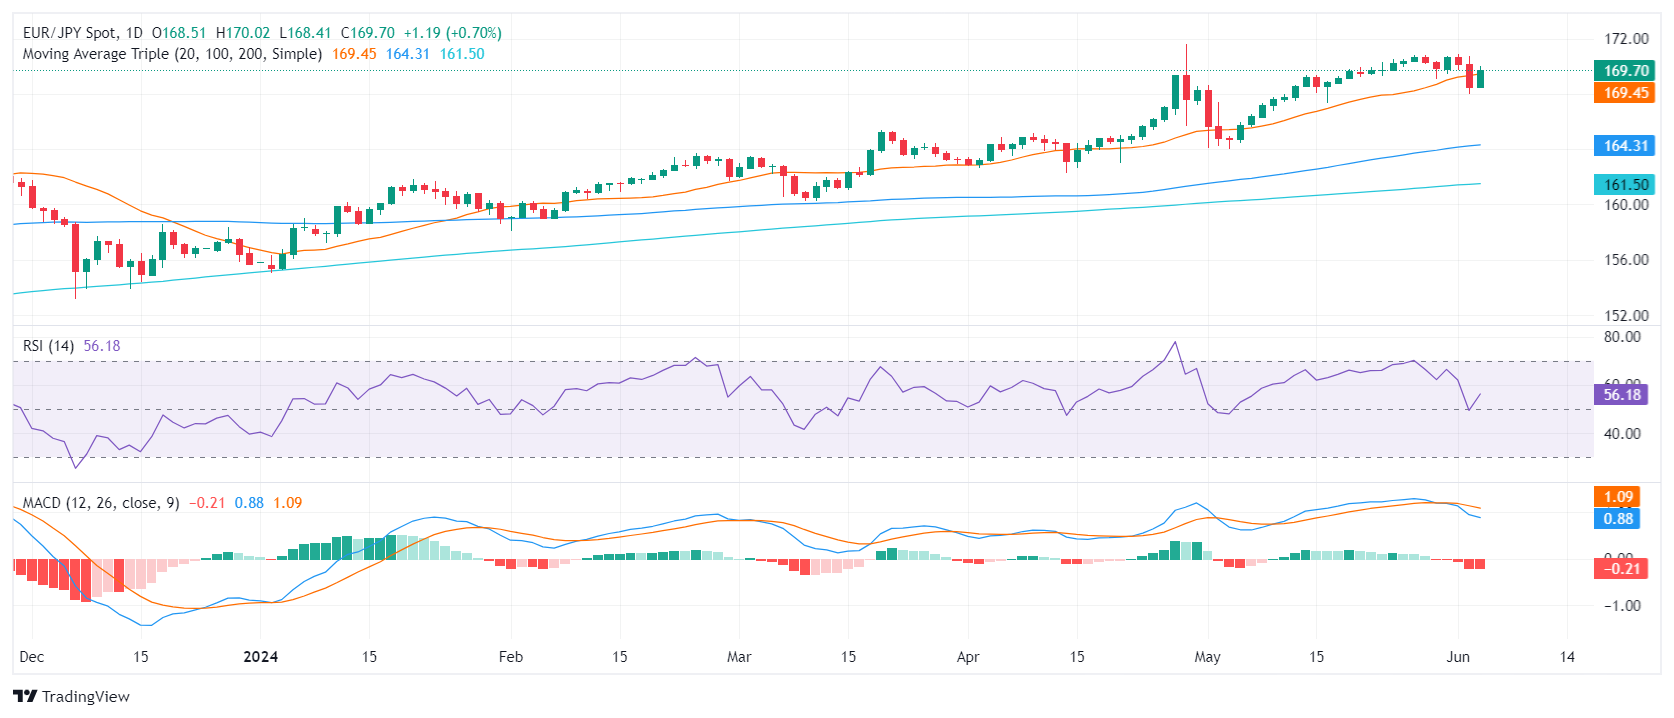
Despite the bearish undertones in the short term, the overall bullish trend remains unaffected. The support offered by the 100 and 200-day Simple Moving Averages (SMAs) at 164.00 and 161.00, respectively, still serve as a barrier to any prolonged downside movements. While sellers have made significant ground in previous sessions, these movements could be corrective rather than trend-reversing.
Although the cross managed to recover ground, the picture could quickly shift back to bearish if the cross fails to hold the recently-gained 169.40 resistance level. For the bulls to maintain momentum, a break back above this level is necessary, which would allow the pair to target the next key level of 170.00.


© 2000-2026. All rights reserved.
This site is managed by Teletrade D.J. LLC 2351 LLC 2022 (Euro House, Richmond Hill Road, Kingstown, VC0100, St. Vincent and the Grenadines).
The information on this website is for informational purposes only and does not constitute any investment advice.
The company does not serve or provide services to customers who are residents of the US, Canada, Iran, The Democratic People's Republic of Korea, Yemen and FATF blacklisted countries.
Making transactions on financial markets with marginal financial instruments opens up wide possibilities and allows investors who are willing to take risks to earn high profits, carrying a potentially high risk of losses at the same time. Therefore you should responsibly approach the issue of choosing the appropriate investment strategy, taking the available resources into account, before starting trading.
Use of the information: full or partial use of materials from this website must always be referenced to TeleTrade as the source of information. Use of the materials on the Internet must be accompanied by a hyperlink to teletrade.org. Automatic import of materials and information from this website is prohibited.
Please contact our PR department if you have any questions or need assistance at pr@teletrade.global.
transfers