- Analytics
- News and Tools
- Market News
- USD/CAD Price Analysis: Maintains position above 1.3650 due to weakening bearish bias
USD/CAD Price Analysis: Maintains position above 1.3650 due to weakening bearish bias
- USD/CAD could extend its gains as the 14-day RSI indicates a momentum shift toward the upside.
- The momentum indicator MACD also suggests a weakening bearish bias as converging below the signal line.
- A break below the 1.3600 could exert downward pressure on the pair.
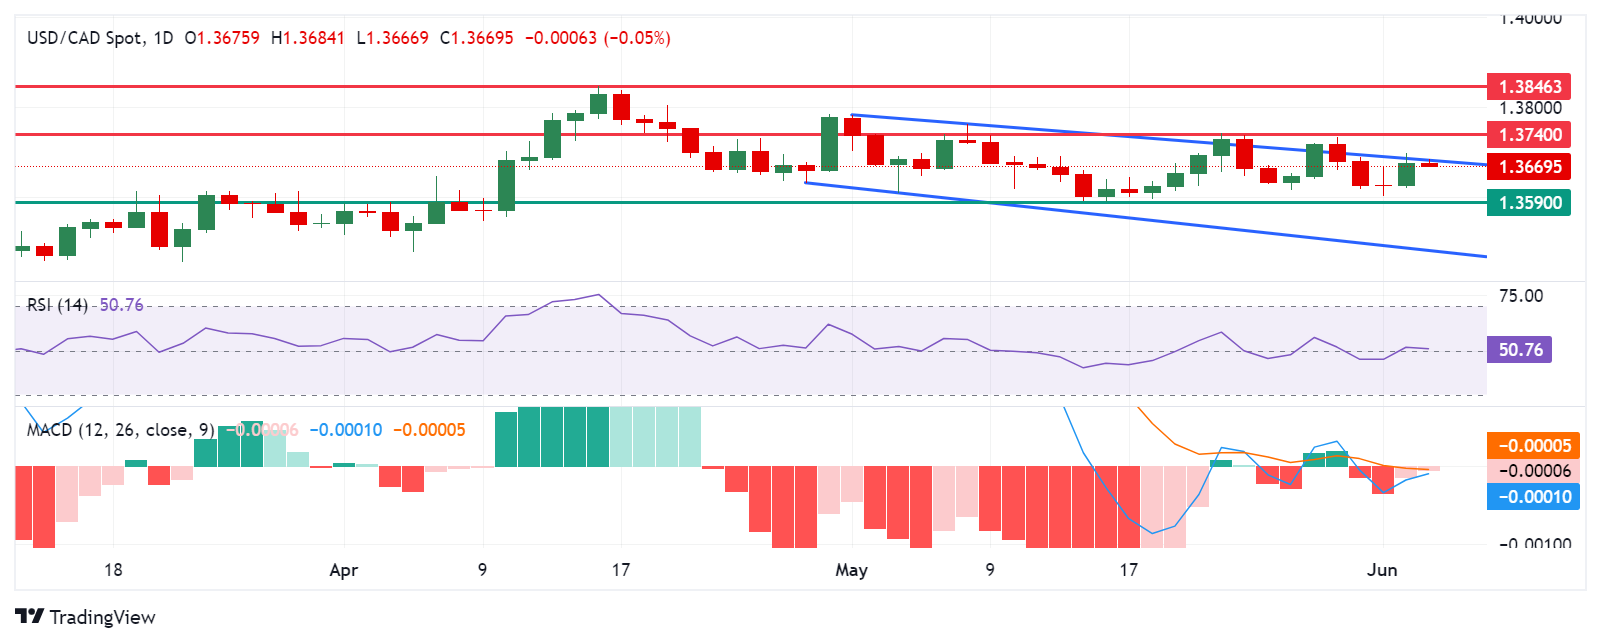
USD/CAD treads water to continue its gains for the second consecutive session, trading around 1.3680 during the European hours on Wednesday. Analysis of the daily chart suggests a bearish bias for the USD/CAD pair, as it remains within a descending channel. However, the 14-day Relative Strength Index (RSI) has slightly moved above the 50 level, and further upward movement may indicate a weakening of this bearish bias.
The Moving Average Convergence Divergence (MACD) indicator suggests a potential momentum shift for the USD/CAD pair. While the MACD line is positioned below the centerline, it shows convergence below the signal line. A break above the centerline could further weaken the bearish trend.
The USD/CAD pair could find key support around the psychological level of 1.3600 and the throwback support at 1.3590. A break below the latter could exert downward pressure on the pair, leading it to test the psychological level of 1.3500, followed by the lower threshold of the descending channel.
On the upside, the USD/CAD pair could break above the upper boundary of the descending channel, followed by a psychological level of 1.3700 and a pullback resistance of 1.3740. A breakthrough above this resistance could lead the pair to explore the region around the key level of 1.3800, followed by April’s high of 1.3846.
USD/CAD: Daily Chart


© 2000-2026. All rights reserved.
This site is managed by Teletrade D.J. LLC 2351 LLC 2022 (Euro House, Richmond Hill Road, Kingstown, VC0100, St. Vincent and the Grenadines).
The information on this website is for informational purposes only and does not constitute any investment advice.
The company does not serve or provide services to customers who are residents of the US, Canada, Iran, The Democratic People's Republic of Korea, Yemen and FATF blacklisted countries.
Making transactions on financial markets with marginal financial instruments opens up wide possibilities and allows investors who are willing to take risks to earn high profits, carrying a potentially high risk of losses at the same time. Therefore you should responsibly approach the issue of choosing the appropriate investment strategy, taking the available resources into account, before starting trading.
Use of the information: full or partial use of materials from this website must always be referenced to TeleTrade as the source of information. Use of the materials on the Internet must be accompanied by a hyperlink to teletrade.org. Automatic import of materials and information from this website is prohibited.
Please contact our PR department if you have any questions or need assistance at pr@teletrade.global.
transfers