- Analytics
- News and Tools
- Market News
- GBP/USD Price Analysis: Remains close to over two-month peak, bullish potential intact
GBP/USD Price Analysis: Remains close to over two-month peak, bullish potential intact
- GBP/USD attracts fresh buying on Wednesday amid the underlying USD bearish tone.
- Divergent Fed-BoE policy expectations turn out to be another factor lending support.
- The technical setup favors bullish traders and supports prospects for additional gains.
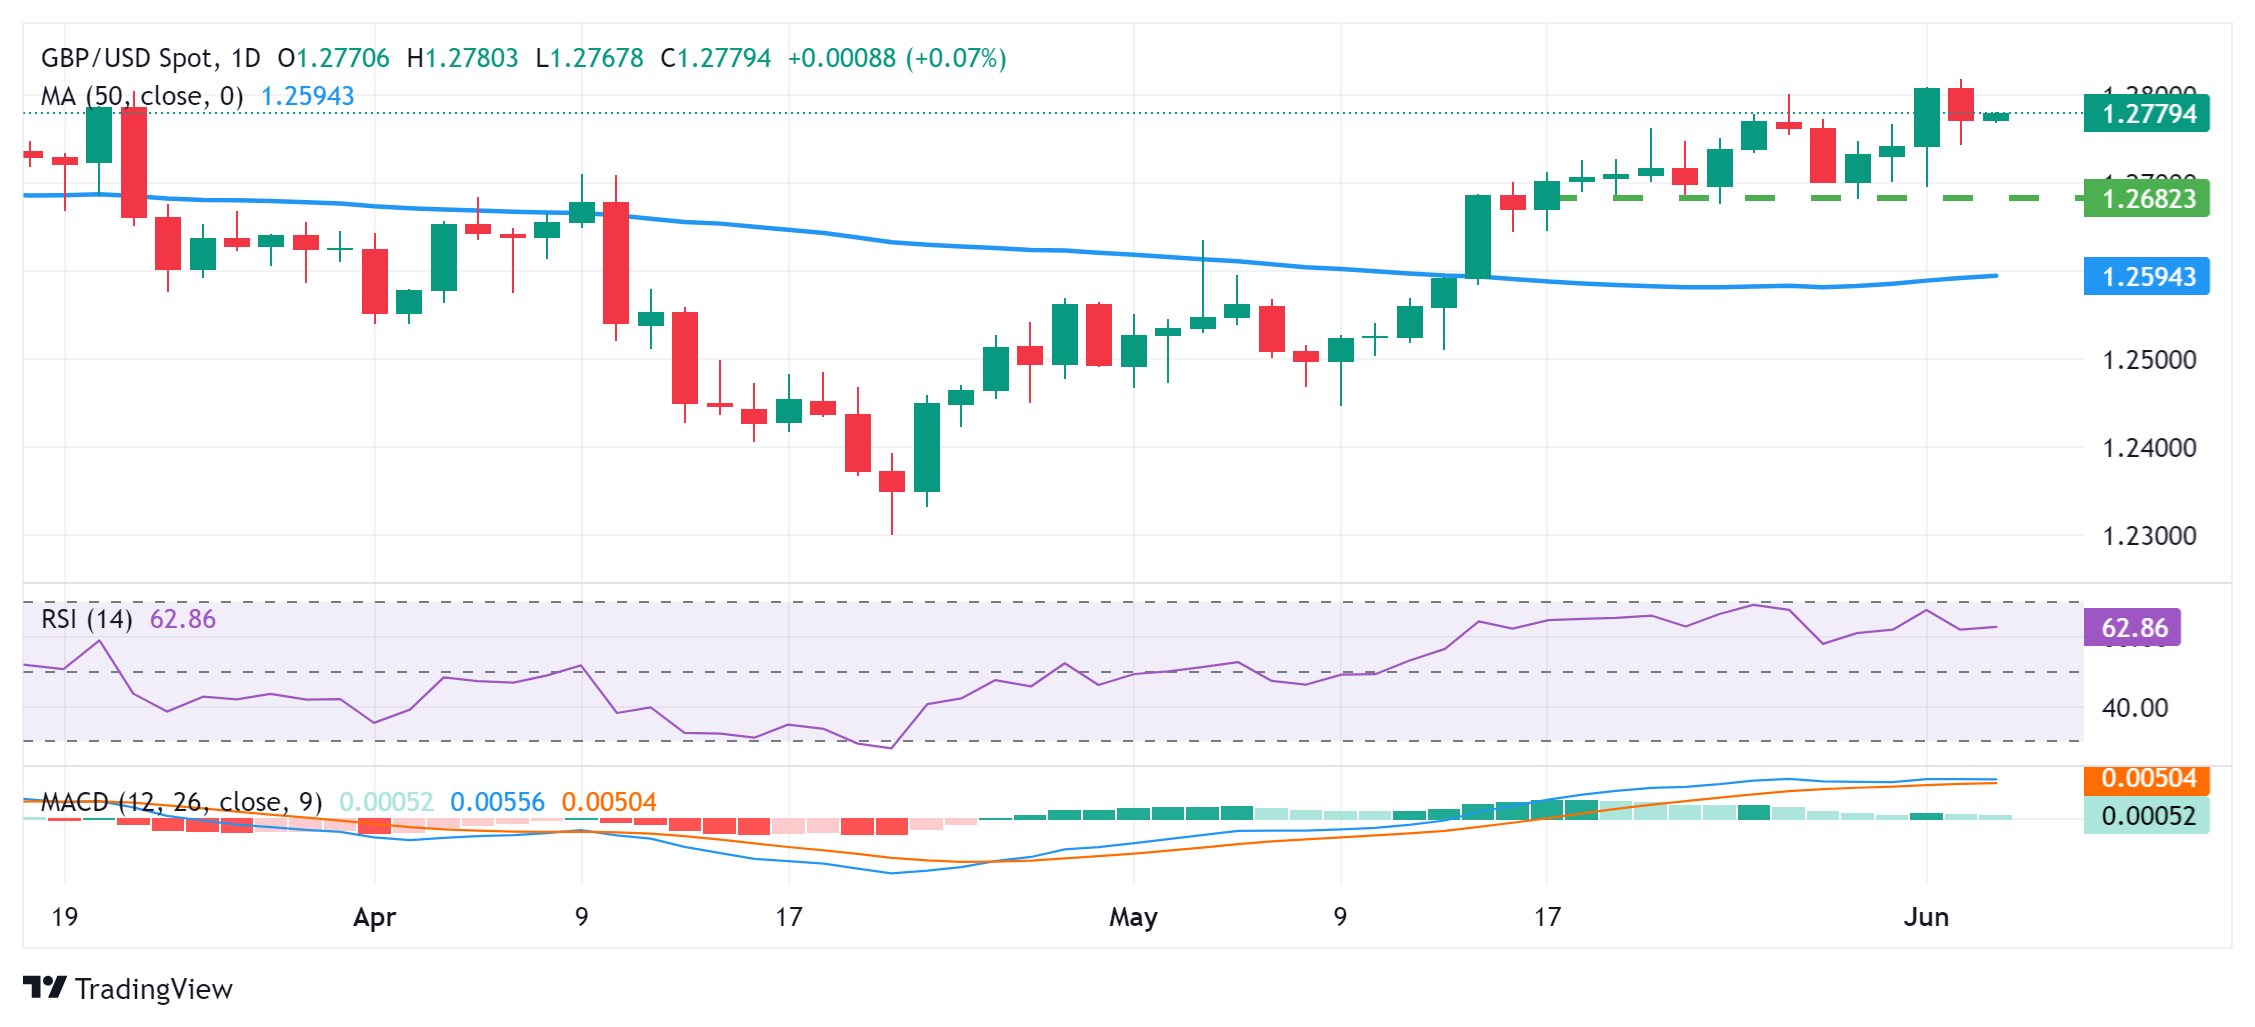
The GBP/USD pair trades with a mild positive bias around the 1.2775-1.2780 area during the Asian session on Wednesday and remains well within the striking distance of its highest level since March 14 touched the previous day.
The US Dollar (USD) struggles to capitalize on the overnight bounce from over a two-month low in the wake of rising bets for an imminent interest rate cut by the Federal Reserve (Fed) later this year. Furthermore, expectations that the Bank of England (BoE) might keep interest rates at their current level for a little bit longer continue to underpin the British Pound (GBP) and act as a tailwind for the GBP/USD pair.
From a technical perspective, oscillators on the daily chart are holding in the positive territory and are still away from being in the overbought zone. This, in turn, supports prospects for further gains. Some follow-through buying beyond the 1.2800 mark will reaffirm the positive bias and lift the GBP/USD pair to the 1.2855-1.2860 area en route to the 1.2900 neighborhood or the YTD peak touched in March.
On the flip side, the overnight swing low, around the 1.2745-1.2740 region, now seems to protect the immediate downside ahead of the 1.2725-1.2720 area. The latter is followed by the 1.2700 mark, which if broken should pave the way for a slide towards the next relevant support near mid-1.2600s. Spot prices might eventually drop to test sub-1.2600 levels, or the 50-day Simple Moving Average (SMA) support.
GBP/USD daily chart


© 2000-2026. All rights reserved.
This site is managed by Teletrade D.J. LLC 2351 LLC 2022 (Euro House, Richmond Hill Road, Kingstown, VC0100, St. Vincent and the Grenadines).
The information on this website is for informational purposes only and does not constitute any investment advice.
The company does not serve or provide services to customers who are residents of the US, Canada, Iran, The Democratic People's Republic of Korea, Yemen and FATF blacklisted countries.
Making transactions on financial markets with marginal financial instruments opens up wide possibilities and allows investors who are willing to take risks to earn high profits, carrying a potentially high risk of losses at the same time. Therefore you should responsibly approach the issue of choosing the appropriate investment strategy, taking the available resources into account, before starting trading.
Use of the information: full or partial use of materials from this website must always be referenced to TeleTrade as the source of information. Use of the materials on the Internet must be accompanied by a hyperlink to teletrade.org. Automatic import of materials and information from this website is prohibited.
Please contact our PR department if you have any questions or need assistance at pr@teletrade.global.
transfers