- Analytics
- News and Tools
- Market News
- EUR/JPY Price Analysis: Bears assert their dominance, push the pair the below 20-day SMA
EUR/JPY Price Analysis: Bears assert their dominance, push the pair the below 20-day SMA
- The daily RSI has continued on its downward trajectory, backed by the rising red bards on the MACD.
- Previously strong support at 20-day SMA has been breached, opening the potential for further bearish movements in the short term.
- The existing bullish trend finds defense in the 100 and 200-day SMAs, around the 164.00 and 161.00 levels respectively.
In Tuesday's session, the EUR/JPY pair endured significant selling pressure pushing below the cross below the strong support level of the 20-day Simple Moving Average (SMA) at 169.30, and touching a low of 168.50. Although this bearish movement puts a dampener on the outlook over the short term, the overall bullish outlook remains unaffected.
This shift in momentum aligns with the downward turn noted in the daily Relative Strength Index (RSI), which now stands at 46, compared to the higher reading of 61 in Monday's session. This indicates a loss in buying momentum, echoed by the daily Moving Average Convergence Divergence (MACD) which exhibits increasing red bars.
EUR/JPY daily chart
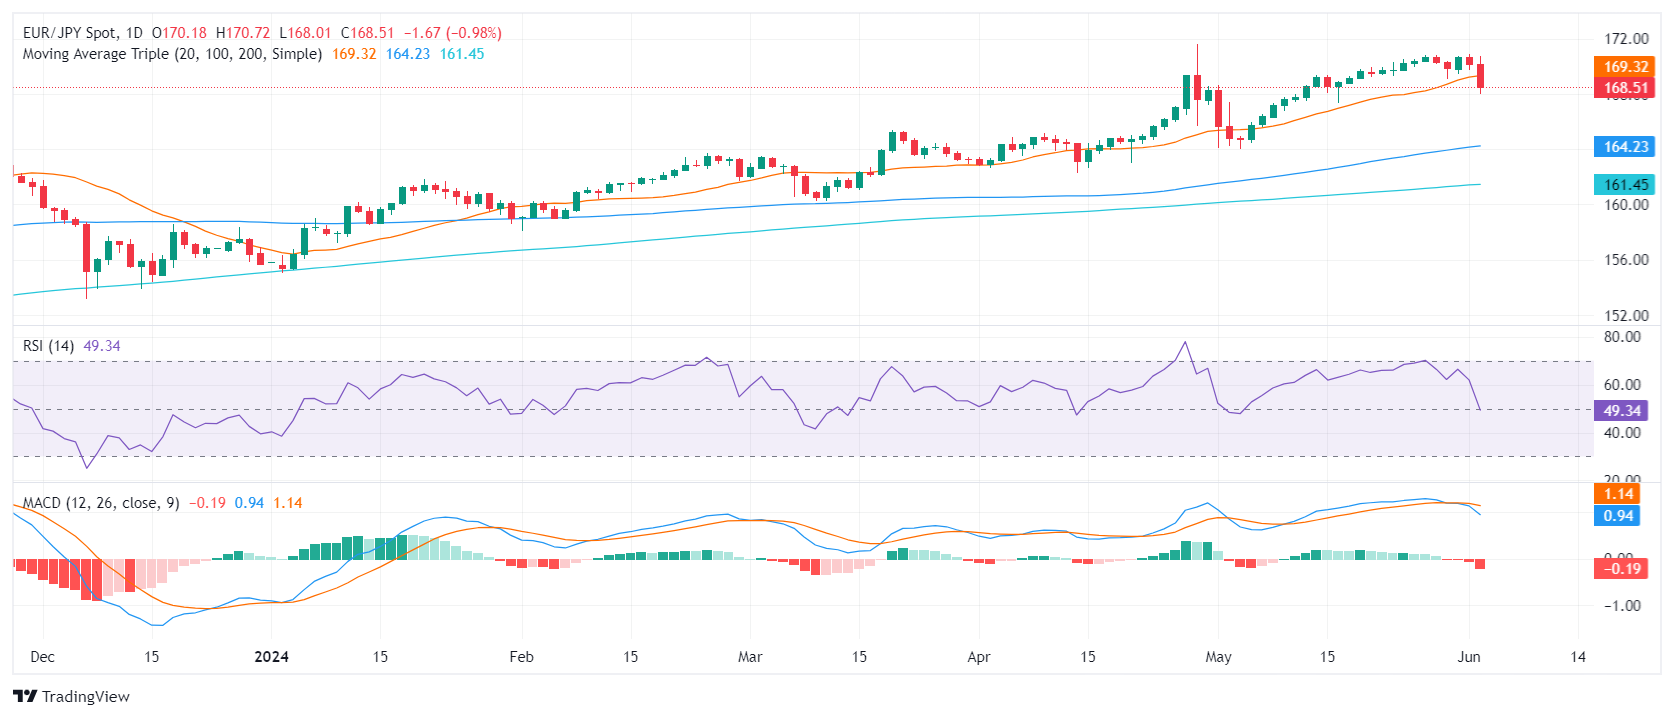
Looking at the broader picture, despite the short-term bearishness, the lengthy bullish trend remains unaffected for the moment. The support given by the 100 and 200-day Simple Moving Averages (SMAs) at 164.00 and 161.00 respectively will need to be broken in order to flip the table. Conversely, for the bulls to regain momentum, they will need to recapture the 169.30 region, which recently turned from support to resistance.


© 2000-2026. All rights reserved.
This site is managed by Teletrade D.J. LLC 2351 LLC 2022 (Euro House, Richmond Hill Road, Kingstown, VC0100, St. Vincent and the Grenadines).
The information on this website is for informational purposes only and does not constitute any investment advice.
The company does not serve or provide services to customers who are residents of the US, Canada, Iran, The Democratic People's Republic of Korea, Yemen and FATF blacklisted countries.
Making transactions on financial markets with marginal financial instruments opens up wide possibilities and allows investors who are willing to take risks to earn high profits, carrying a potentially high risk of losses at the same time. Therefore you should responsibly approach the issue of choosing the appropriate investment strategy, taking the available resources into account, before starting trading.
Use of the information: full or partial use of materials from this website must always be referenced to TeleTrade as the source of information. Use of the materials on the Internet must be accompanied by a hyperlink to teletrade.org. Automatic import of materials and information from this website is prohibited.
Please contact our PR department if you have any questions or need assistance at pr@teletrade.global.
transfers