- Analytics
- News and Tools
- Market News
- USD/CAD Price Analysis: Rises toward 1.3700 despite a bearish bias
USD/CAD Price Analysis: Rises toward 1.3700 despite a bearish bias
- USD/CAD gains ground despite a bearish bias suggested by daily chart analysis.
- The momentum indicator MACD also suggests a bearish trend for the pair.
- A break above the upper boundary of the descending channel and the psychological level of 1.3700 could weaken the bearish bias.
USD/CAD halts its three-day losing streak, trading around 1.3680 during the European hours on Tuesday. The appreciation of the pair is attributed to the decline in crude Oil prices, given the fact that Canada is the largest Oil exporter to the United States (US).
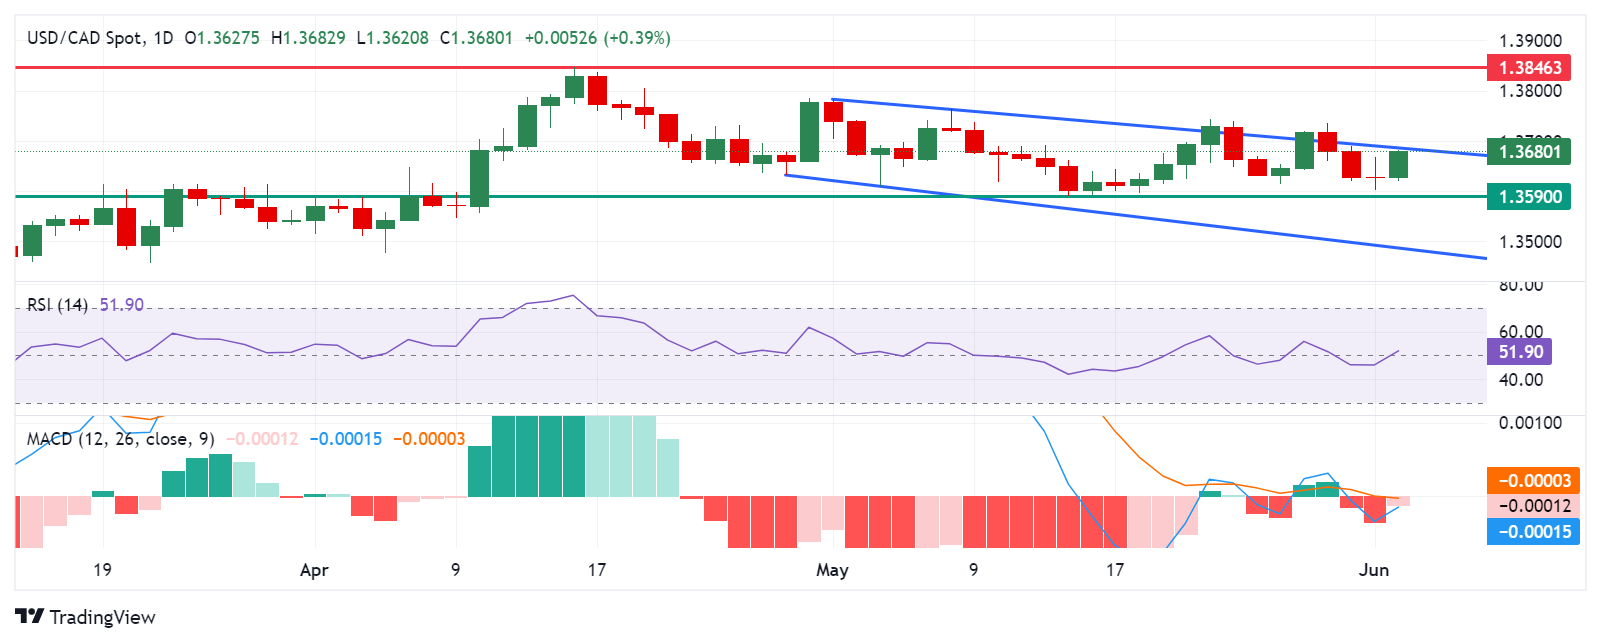
The analysis of the daily chart suggests the bearish bias for the USD/CAD pair, as it lies within the descending channel. Additionally, the 14-day Relative Strength Index (RSI) is positioned slightly above the 50 level, further movement may offer a clear directional trend.
The momentum indicator Moving Average Convergence Divergence (MACD) also suggests a bearish trend for the USD/CAD pair as the MACD line is positioned below the centerline and the signal line. However, the convergence below the signal line could lead to a momentum shift. A breakthrough above the centerline could weaken the bearish trend.
The USD/CAD pair could find the key support around the psychological level of 1.3600 and a throwback support of 1.3590. A break below this region could exert downward pressure on the pair to navigate around the significant level of 1.3500. Further support may appear at the lower threshold of the descending channel.
On the upside, the USD/CAD pair tests the upper boundary of the descending channel, followed by the psychological level of 1.3700. A breakthrough above the latter could weaken the bearish bias and lead the pair to explore the region around the key level of 1.3800, followed by April’s high of 1.3846.
USD/CAD: Daily Chart


© 2000-2026. All rights reserved.
This site is managed by Teletrade D.J. LLC 2351 LLC 2022 (Euro House, Richmond Hill Road, Kingstown, VC0100, St. Vincent and the Grenadines).
The information on this website is for informational purposes only and does not constitute any investment advice.
The company does not serve or provide services to customers who are residents of the US, Canada, Iran, The Democratic People's Republic of Korea, Yemen and FATF blacklisted countries.
Making transactions on financial markets with marginal financial instruments opens up wide possibilities and allows investors who are willing to take risks to earn high profits, carrying a potentially high risk of losses at the same time. Therefore you should responsibly approach the issue of choosing the appropriate investment strategy, taking the available resources into account, before starting trading.
Use of the information: full or partial use of materials from this website must always be referenced to TeleTrade as the source of information. Use of the materials on the Internet must be accompanied by a hyperlink to teletrade.org. Automatic import of materials and information from this website is prohibited.
Please contact our PR department if you have any questions or need assistance at pr@teletrade.global.
transfers