- Analytics
- News and Tools
- Market News
- USD/JPY Price Analysis: Struggles at 157.00 as bearish engulfing chart pattern looms
USD/JPY Price Analysis: Struggles at 157.00 as bearish engulfing chart pattern looms
- USD/JPY retreats as it forms a bearish engulfing candle chart pattern.
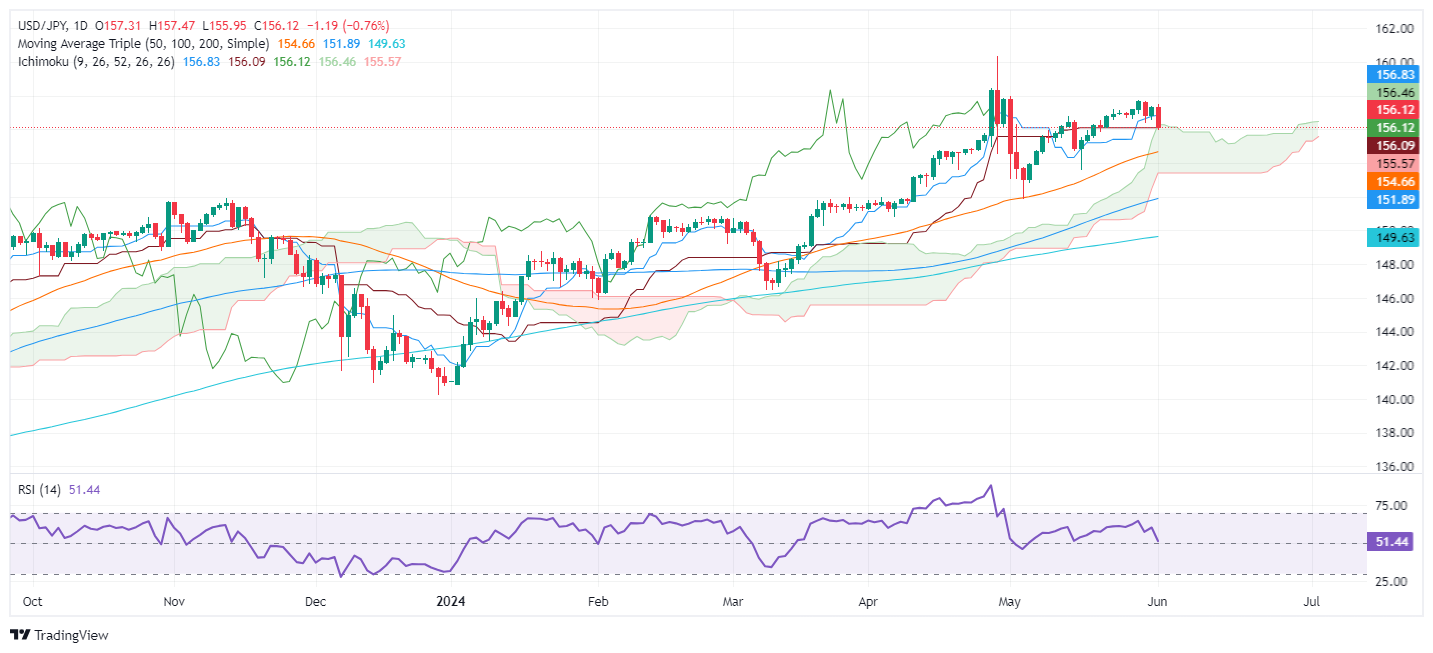
- Technical outlook: USD/JPY drops below Ichimoku Cloud top at 155.95, hinting at potential further declines.
- Key support levels: Tenkan-Sen at 154.92, 50-DMA at 154.74, and trendline at 154.20; resistance at Kumo top 156.15/20 and May 29 high of 157.71.
The USD/JPY retreated more than 0.70% on Monday following softer-than-expected business activity data in the United States (US). That, along with last Friday’s inflation report, the Fed’s Core PCE, reignited speculation that the US central bank could slash rates toward the end of the year. The pair trades at 156.14.
USD/JPY Price Analysis: Technical outlook
From a daily chart perspective, the USD/JPY failed to pierce the 157.50 resistance level and dived below the 157.00 figure, exacerbating a drop below the top of the Ichimoku Cloud (Kumo) at around 155.95, opening the door for further losses.
Even though momentum favors buyers, as depicted by the Relative Strength Index (RSI), it has turned flat close to the 50 midlines, about to enter bearish territory.
In the short term, the USD/JPY is neutral to downward biased. The first support would be the Tenkan-Sen at 154.92, followed by the 50-day moving average (DMA) at 154.74. Once cleared, the next stop would be an upslope support trendline at 154.20 before testing the bottom of the Kumo at 153.30/40.
Conversely, if USD/JPY climbs above the top of the Kumo at around 156.15/20, that would sponsor an uptick toward the May 29 high at 157.71.
USD/JPY Price Action – Daily Chart


© 2000-2026. All rights reserved.
This site is managed by Teletrade D.J. LLC 2351 LLC 2022 (Euro House, Richmond Hill Road, Kingstown, VC0100, St. Vincent and the Grenadines).
The information on this website is for informational purposes only and does not constitute any investment advice.
The company does not serve or provide services to customers who are residents of the US, Canada, Iran, The Democratic People's Republic of Korea, Yemen and FATF blacklisted countries.
Making transactions on financial markets with marginal financial instruments opens up wide possibilities and allows investors who are willing to take risks to earn high profits, carrying a potentially high risk of losses at the same time. Therefore you should responsibly approach the issue of choosing the appropriate investment strategy, taking the available resources into account, before starting trading.
Use of the information: full or partial use of materials from this website must always be referenced to TeleTrade as the source of information. Use of the materials on the Internet must be accompanied by a hyperlink to teletrade.org. Automatic import of materials and information from this website is prohibited.
Please contact our PR department if you have any questions or need assistance at pr@teletrade.global.
transfers