- Analytics
- News and Tools
- Market News
- NZD/JPY Price Analysis: Sellers test strength as consolidation persists
NZD/JPY Price Analysis: Sellers test strength as consolidation persists
- Negative momentum nudges the NZD/JPY pair into a slight retreat, with consolidation continuing to dominate the trend.
- The sellers face a considerable barrier at the 96.30 area.
- The buying momentum continues to be limited.
During Monday's session, the NZD/JPY pair experienced a slight retreat as the sellers tried pushing past a strong resistance at the 96.30 area. However, the charm offensive from the buyers wasn't entirely diminished, holding the pair in a protracted consolidation phase over the course of the day.
Though still well within positive territory, the Relative Strength Index (RSI) has dropped to 67, from 71. This drop, mild in nature, indicates a reduction in the momentum that characterized the previous session's overbought situation However, on Monday the index managed to jump back near the 70 threshold suggesting that there is still more toom to correct. Concurrently, the Moving Average Convergence Divergence (MACD) continues to register decreasing green bars, suggesting a decline in buying momentum. The combination of these factors implies the potential for a continued period of consolidation, rather than a reversal of the uptrend seen recently.
NZD/JPY daily chart
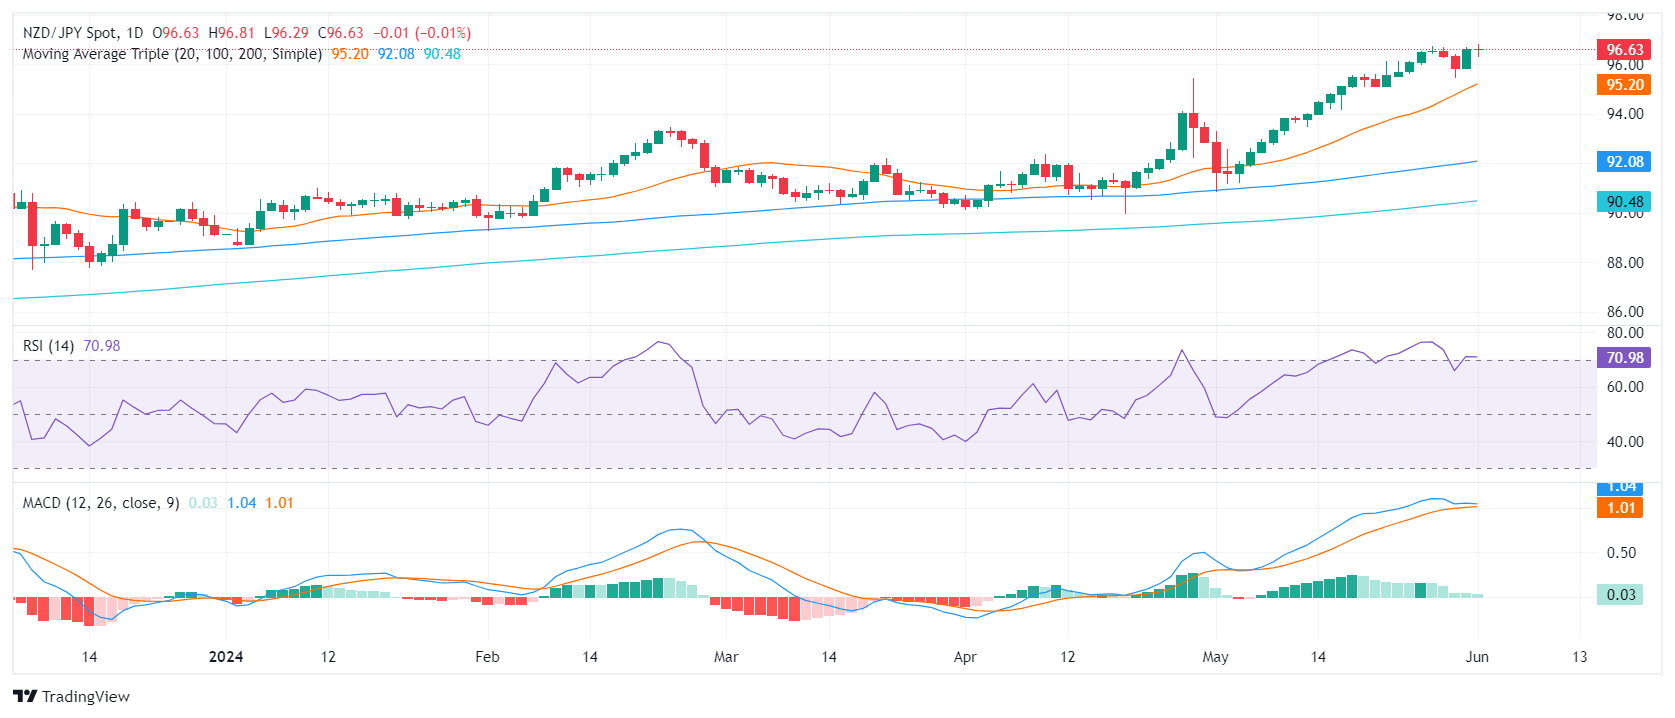
This retreat is by no means a synonym for reversal. The outlook still remains positive, and the NZD/JPY pair continues to rest well above a healthy support level at 95.50. For the balance to tip in favor of the sellers, they would need to crack this support and break below the 20-day Simple Moving Average (SMA) at 95.20, a level that has provided reliable support for buyers since the beginning of May. Until then, the current pattern is likely to be viewed as corrective and part of the ongoing consolidation phase.


© 2000-2026. All rights reserved.
This site is managed by Teletrade D.J. LLC 2351 LLC 2022 (Euro House, Richmond Hill Road, Kingstown, VC0100, St. Vincent and the Grenadines).
The information on this website is for informational purposes only and does not constitute any investment advice.
The company does not serve or provide services to customers who are residents of the US, Canada, Iran, The Democratic People's Republic of Korea, Yemen and FATF blacklisted countries.
Making transactions on financial markets with marginal financial instruments opens up wide possibilities and allows investors who are willing to take risks to earn high profits, carrying a potentially high risk of losses at the same time. Therefore you should responsibly approach the issue of choosing the appropriate investment strategy, taking the available resources into account, before starting trading.
Use of the information: full or partial use of materials from this website must always be referenced to TeleTrade as the source of information. Use of the materials on the Internet must be accompanied by a hyperlink to teletrade.org. Automatic import of materials and information from this website is prohibited.
Please contact our PR department if you have any questions or need assistance at pr@teletrade.global.
transfers