- Analytics
- News and Tools
- Market News
- AUD/JPY Price Analysis: Bulls gather momentum, consolidation ongoing
AUD/JPY Price Analysis: Bulls gather momentum, consolidation ongoing
- Daily chart indicators suggest a positive incline; RSI climbs up.
- Hourly chart indicators flatten out in positive territory, indicating consolidation after recent gains.
- The pair is seeing signs of bullish exhaustion after recent gains, with eyes set on support around the 103.60-103.80 area.
In Friday's trading session, the AUD/JPY pair soared to the 104.50 region owing to positive momentum, reinforcing expectations of an overall bullish landscape. However, the market's upward trajectory is showing signs of fatigue, and the pair has entered in a consolidation phase.
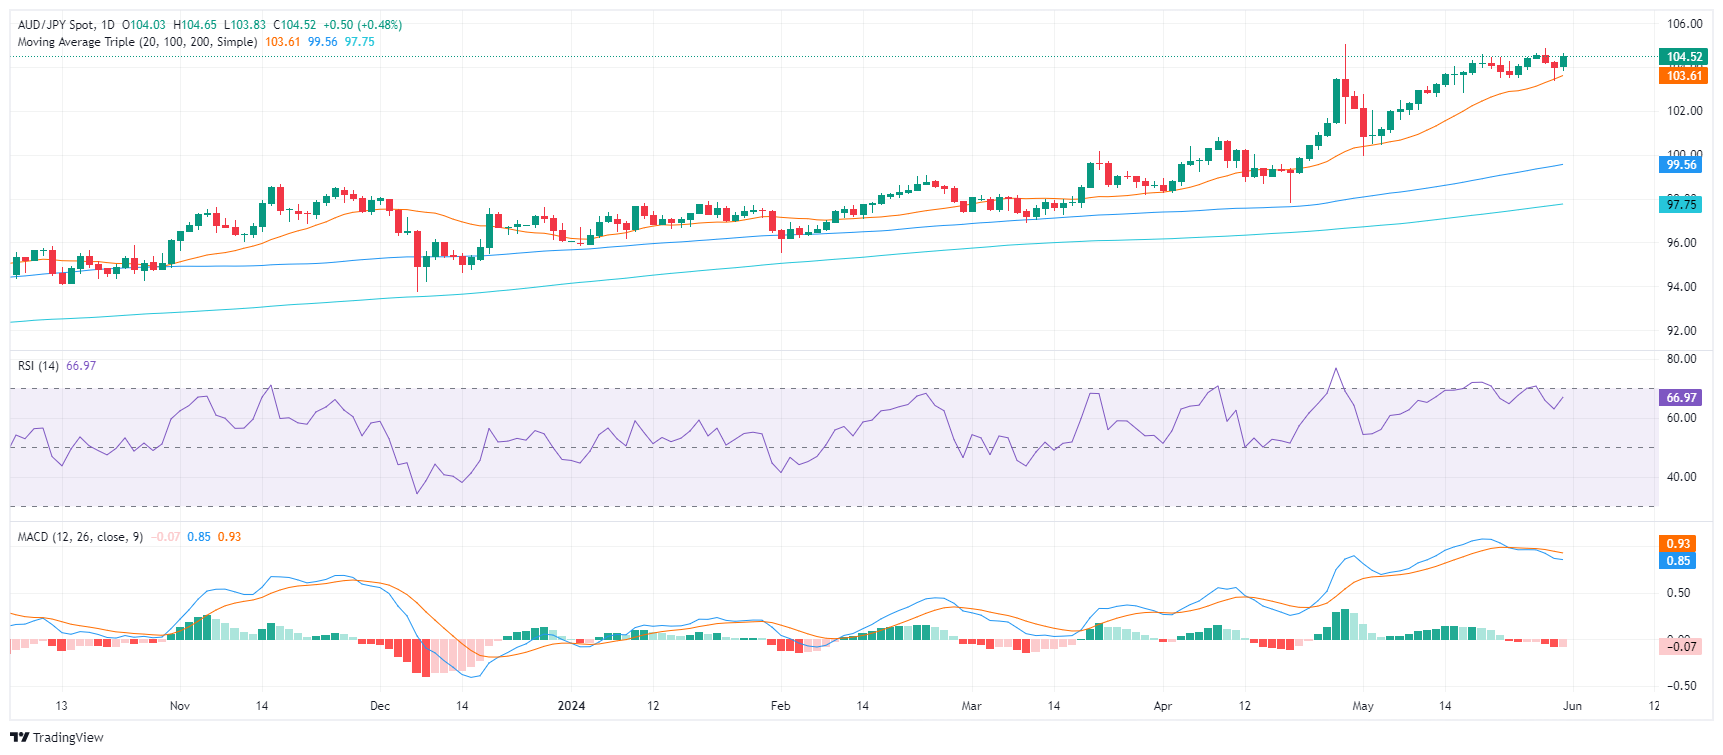
As per the daily chart, the RSI has ascended near to the 70 region, presenting a slight recovery from Wednesday's drop to 67, suggesting a potential halt to the previous downtrend. Corresponding with this, the MACD prints flat red bars, indicating a possible pause in the market's selling traction.
AUD/JPY daily chart
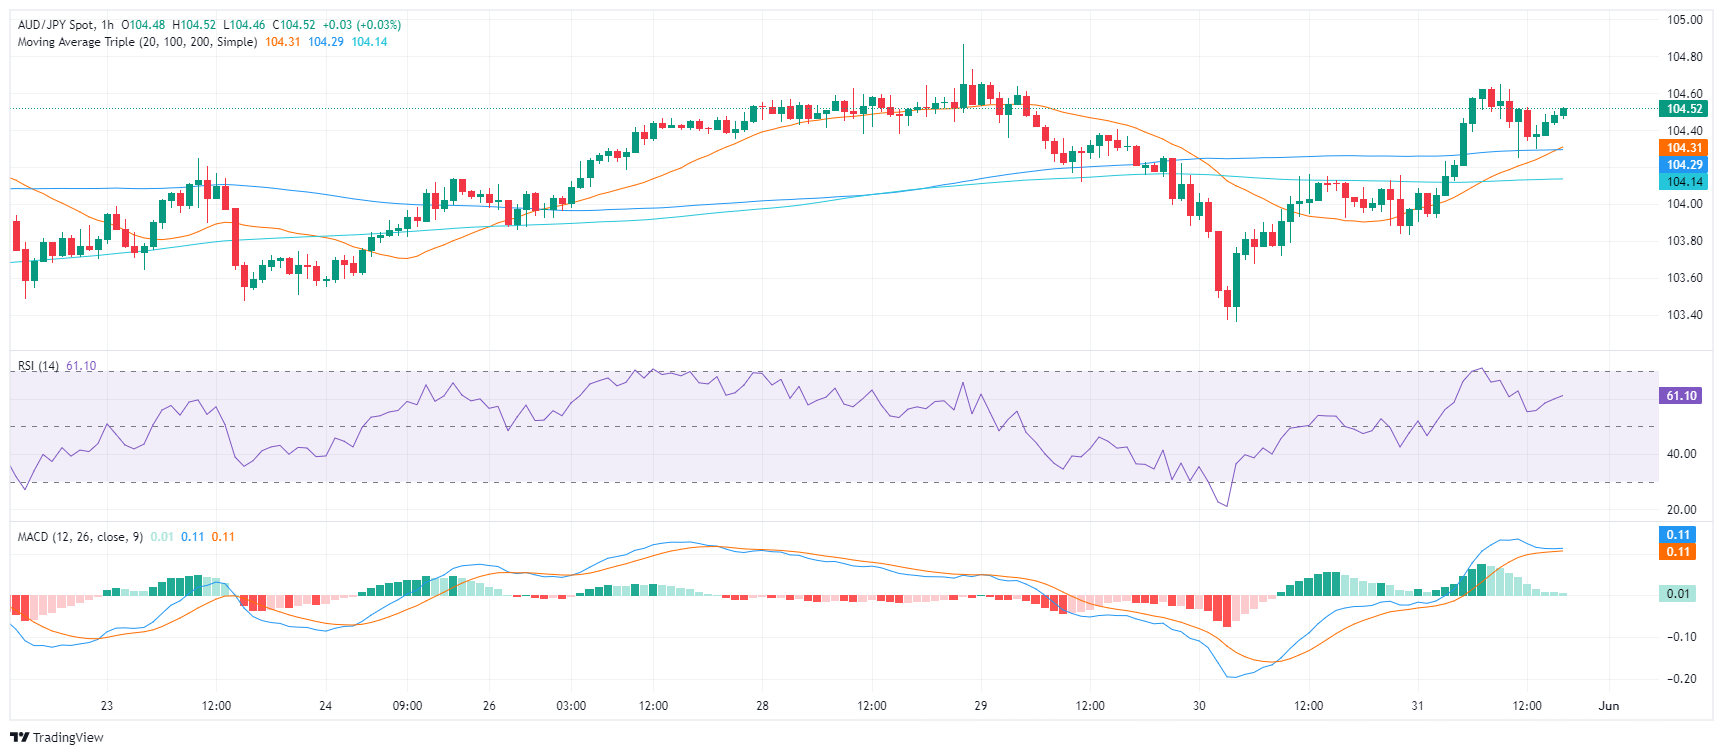
Confirming these dynamics is the hourly chart. The RSI and MACD are greener and have flattened, indicating a potential period of consolidation following the recent rally.
AUD/JPY hourly chart
In retrospect to the session on Thursday, sellers were repelled at the 20-day SMA mark of 103.60 and again on Friday at 103.80. These developments have set a formidable support base around that region, which appears could be leveraged to stabilize the recent gains. Any downturn below the 20-day SMA may risk undermining the short-term bullish atmosphere.


© 2000-2026. All rights reserved.
This site is managed by Teletrade D.J. LLC 2351 LLC 2022 (Euro House, Richmond Hill Road, Kingstown, VC0100, St. Vincent and the Grenadines).
The information on this website is for informational purposes only and does not constitute any investment advice.
The company does not serve or provide services to customers who are residents of the US, Canada, Iran, The Democratic People's Republic of Korea, Yemen and FATF blacklisted countries.
Making transactions on financial markets with marginal financial instruments opens up wide possibilities and allows investors who are willing to take risks to earn high profits, carrying a potentially high risk of losses at the same time. Therefore you should responsibly approach the issue of choosing the appropriate investment strategy, taking the available resources into account, before starting trading.
Use of the information: full or partial use of materials from this website must always be referenced to TeleTrade as the source of information. Use of the materials on the Internet must be accompanied by a hyperlink to teletrade.org. Automatic import of materials and information from this website is prohibited.
Please contact our PR department if you have any questions or need assistance at pr@teletrade.global.
transfers