- Analytics
- News and Tools
- Market News
- USD/CHF plummets following PCE data
USD/CHF plummets following PCE data
- USD/CHF took a downturn in Friday’s session, plummeting to 0.9016, after slightly rising to 0.9070 earlier in the session.
- Following US inflation figures coming in line with market expectations, markets may be anticipating a less aggressive Fed stance.
- The potential for rate cuts in September has increased slightly.
The USD/CHF pair is trading lower following the release of the latest US inflation data on Friday. This change came in despite inflation figures, signaled by the Personal Consumption Expenditures (PCE) Price Index, holding steady at 2.7% YoY in April which matched market expectations.
On the other hand, the Core PCE Price Index, excluding volatile food and energy prices, observed a 2.8% YoY rise, consistent with the analyst's estimate. What seems to be weakening the USD is the lower-than-expected monthly variation of 0.2% which was below the 0.3% expected. The odds for easing by the Federal Reserve (Fed), however, remained mostly unchanged, except for a slight increase in the likelihood of the first-rate cut occurring in September. Those probabilities remain low for June and July.
USD/CHF technical analysis
In the daily analysis, the Relative Strength Index (RSI) has plunged into negative territory, indicating a momentum shift that favors sellers for the time being. Simultaneously, the Moving Average Convergence Divergence (MACD) displays red bars, pointing toward a growing bearish momentum.
USD/CHF daily chart
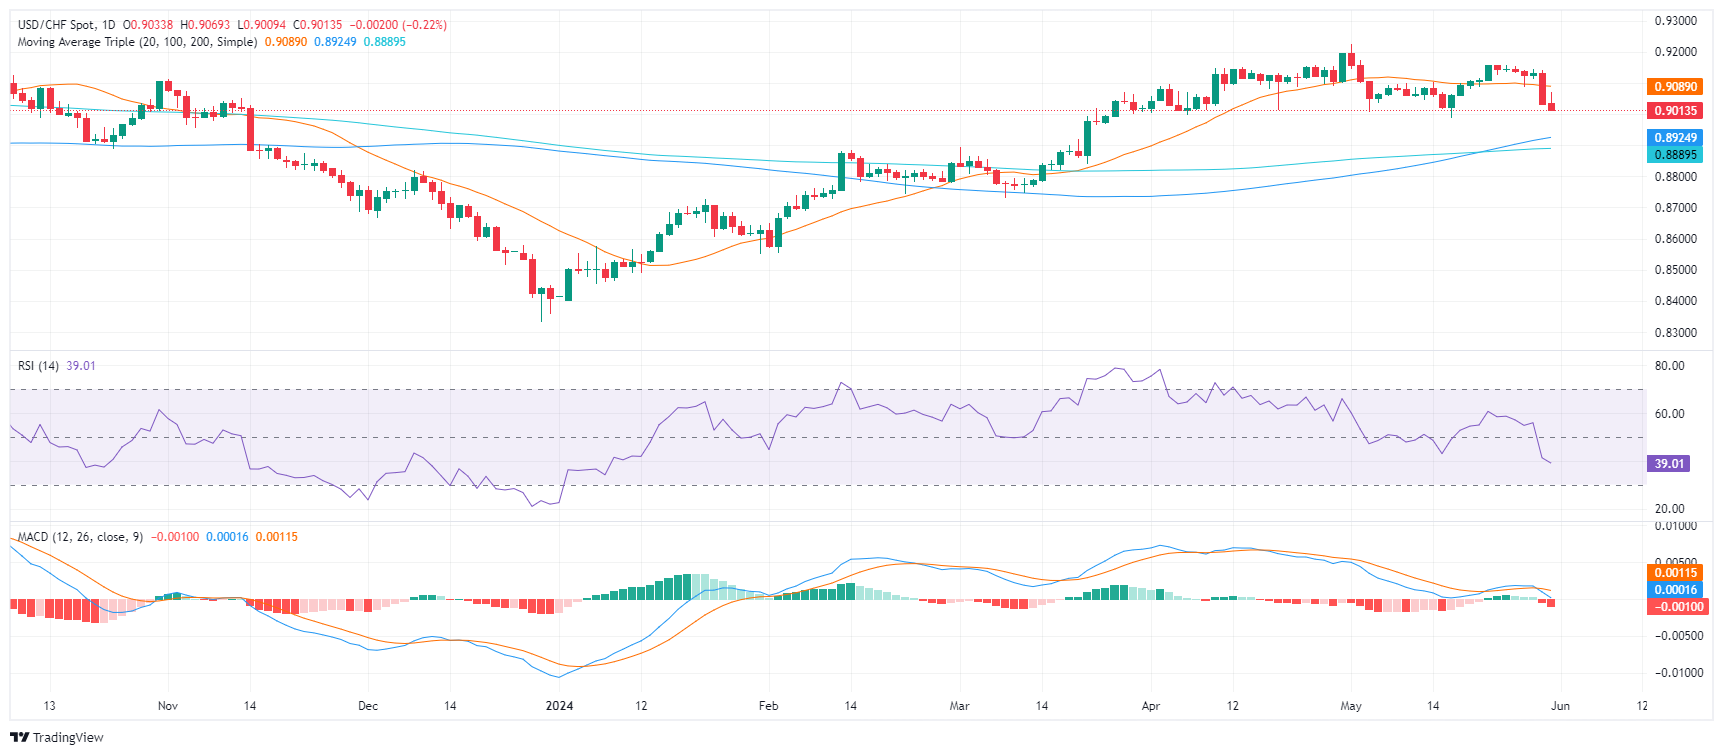
The USD/CHF seems to have lost some of its sheen from earlier in the week, when it stayed above the 20, 100, and 200-day Simple Moving Averages (SMAs). This previous positioning was a strong indicator of a bullish trend, with market dominance leaning towards buyers. However, following the recent downturn, the pair has lost its position above the 20-day SMA at 0.9095, indicating a less positive short-term outlook.


© 2000-2026. All rights reserved.
This site is managed by Teletrade D.J. LLC 2351 LLC 2022 (Euro House, Richmond Hill Road, Kingstown, VC0100, St. Vincent and the Grenadines).
The information on this website is for informational purposes only and does not constitute any investment advice.
The company does not serve or provide services to customers who are residents of the US, Canada, Iran, The Democratic People's Republic of Korea, Yemen and FATF blacklisted countries.
Making transactions on financial markets with marginal financial instruments opens up wide possibilities and allows investors who are willing to take risks to earn high profits, carrying a potentially high risk of losses at the same time. Therefore you should responsibly approach the issue of choosing the appropriate investment strategy, taking the available resources into account, before starting trading.
Use of the information: full or partial use of materials from this website must always be referenced to TeleTrade as the source of information. Use of the materials on the Internet must be accompanied by a hyperlink to teletrade.org. Automatic import of materials and information from this website is prohibited.
Please contact our PR department if you have any questions or need assistance at pr@teletrade.global.
transfers