- Analytics
- News and Tools
- Market News
- EUR/USD Price Analysis: The first upside target emerges above 1.0850
EUR/USD Price Analysis: The first upside target emerges above 1.0850
- EUR/USD drifts lower near 1.0820 in Friday’s early European session.
- The bullish outlook of the pair remains intact above the 100-day EMA on the daily timeframe.
- The immediate resistance level will emerge at 1.0875; the first downside target is seen in the 1.0800-1.0805 zone.
The EUR/USD pair weakens to 1.0820 during the early European trading hours on Friday. Investors prefer to wait on the sidelines ahead of the German Retail Sales and the US Core Personal Consumption Expenditures Price Index (Core PCE) data, which are due later on Friday. The markets expect the Core PCE Price Index inflation to show an increase of 2.8% for the year ended in April and the monthly Core PCE inflation to increase 0.3%.
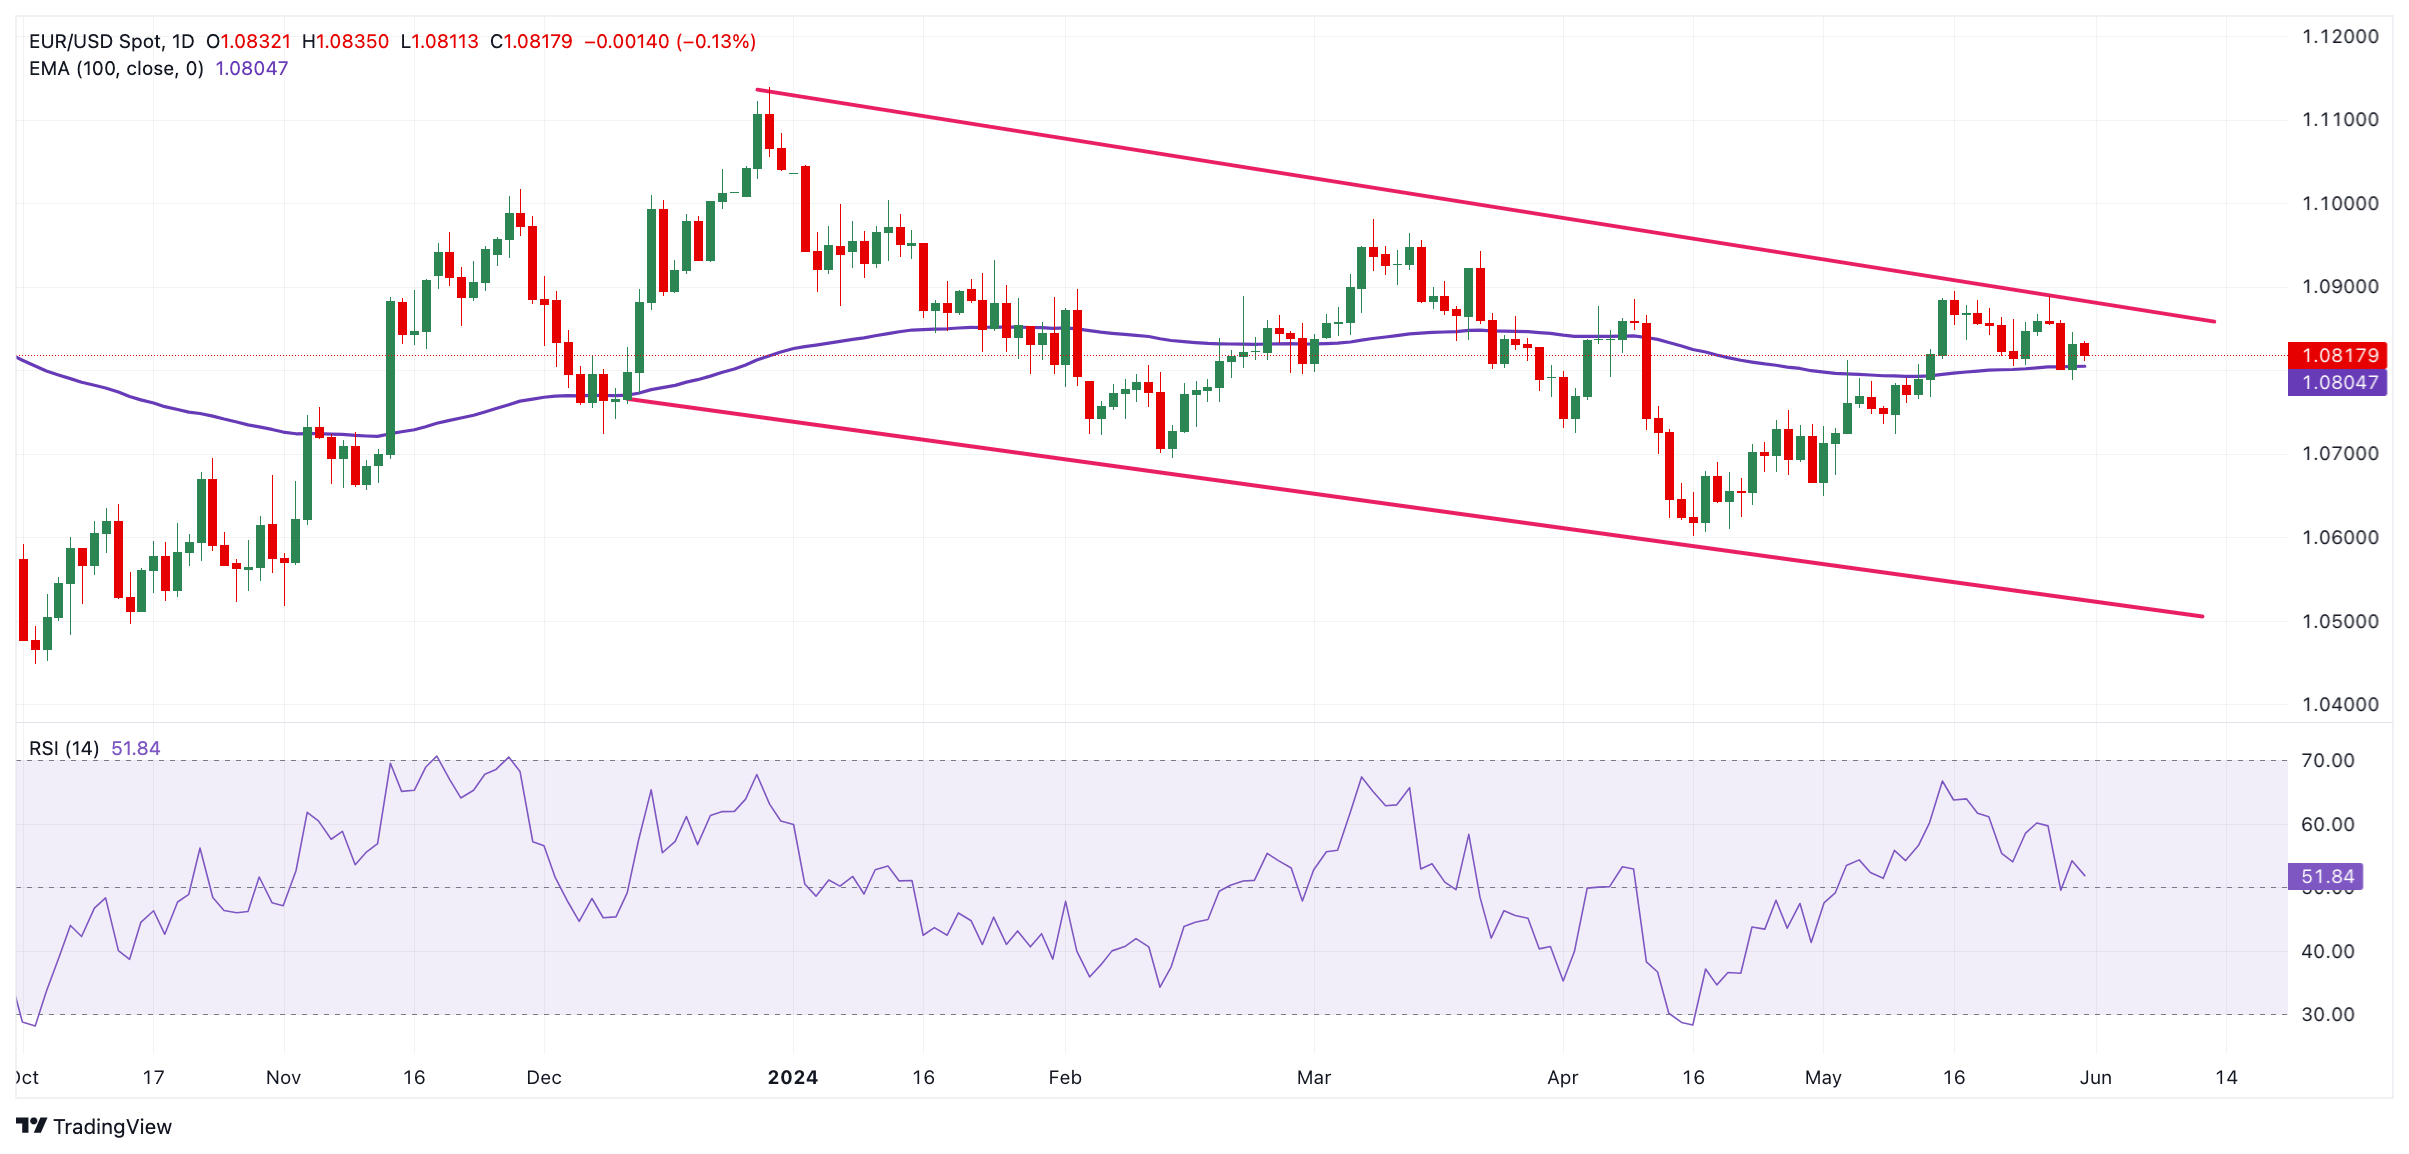
According to the daily chart, EUR/USD remained capped within a descending trend channel since mid-December 2023. The major pair keeps the bullish vibe unchanged as it holds above the key 100-day Exponential Moving Average (EMA). Nonetheless, the 14-day Relative Strength Index (RSI) remains flat around the 50-midline, indicating that further consolidation looks favorable.
The upper boundary of the descending trend channel 1.0875 acts as an immediate resistance level for the major pair. A break above the latter will see a rally to a high of March 21 at 1.0943 en route to a high of March 8 at 1.0981, and finally the 1.1000 psychological level.
On the flip side, the first downside target for EUR/USD will emerge at the 1.0800-1.0805 region, portraying the confluence of the 100-day EMA and psychological level. The additional downside filter to watch is a low of April 2 at 1.0724, followed by a low of May 2 at 1.0650, and finally a low of April 16 at 1.0600.
EUR/USD daily chart


© 2000-2026. All rights reserved.
This site is managed by Teletrade D.J. LLC 2351 LLC 2022 (Euro House, Richmond Hill Road, Kingstown, VC0100, St. Vincent and the Grenadines).
The information on this website is for informational purposes only and does not constitute any investment advice.
The company does not serve or provide services to customers who are residents of the US, Canada, Iran, The Democratic People's Republic of Korea, Yemen and FATF blacklisted countries.
Making transactions on financial markets with marginal financial instruments opens up wide possibilities and allows investors who are willing to take risks to earn high profits, carrying a potentially high risk of losses at the same time. Therefore you should responsibly approach the issue of choosing the appropriate investment strategy, taking the available resources into account, before starting trading.
Use of the information: full or partial use of materials from this website must always be referenced to TeleTrade as the source of information. Use of the materials on the Internet must be accompanied by a hyperlink to teletrade.org. Automatic import of materials and information from this website is prohibited.
Please contact our PR department if you have any questions or need assistance at pr@teletrade.global.
transfers