- Analytics
- News and Tools
- Market News
- EUR/JPY Price Analysis: Cross faces further correction as bulls retreat
EUR/JPY Price Analysis: Cross faces further correction as bulls retreat
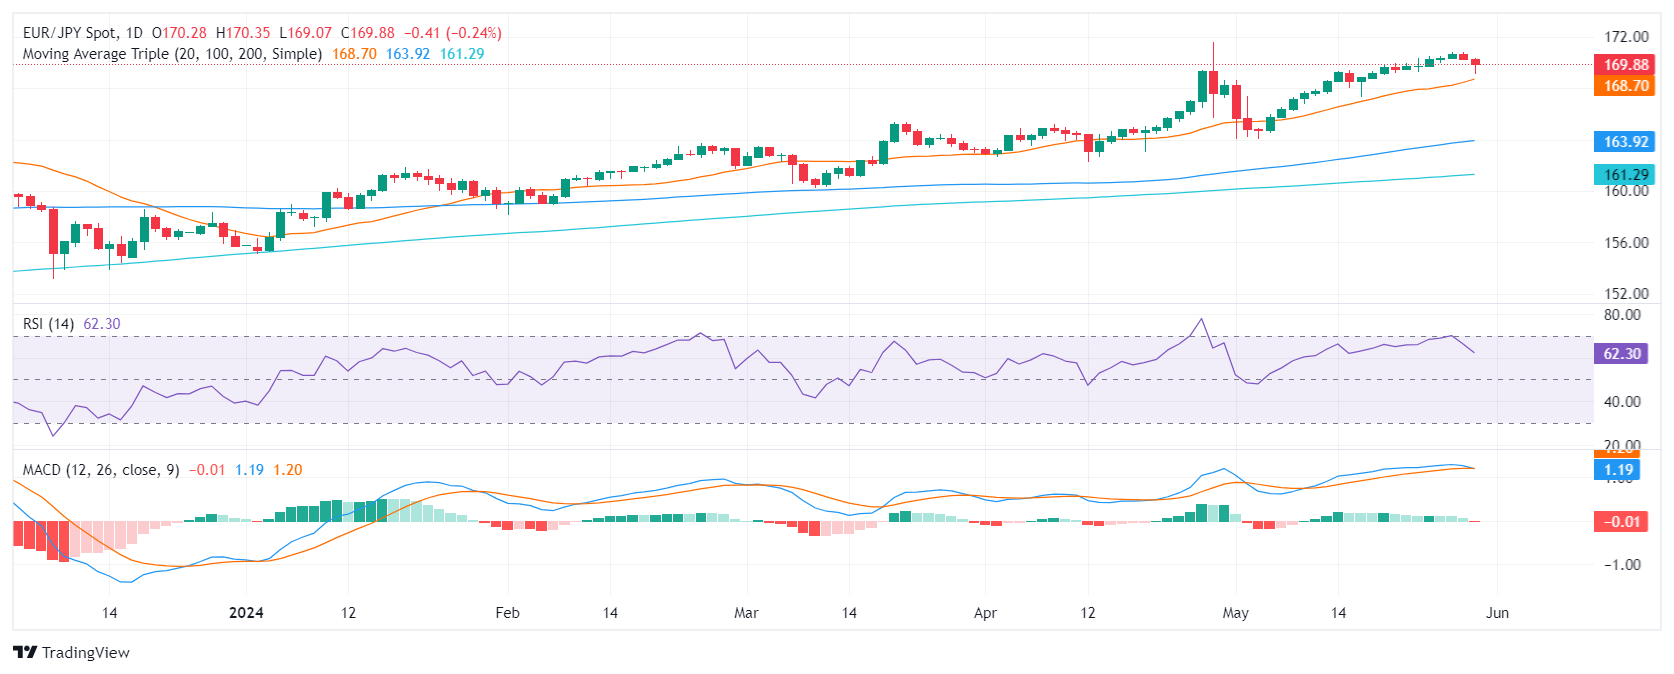
- The daily RSI is pointing downwards, standing near 70, and the MACD has printed a fresh red bar, indicating a deeper consolidation phase.
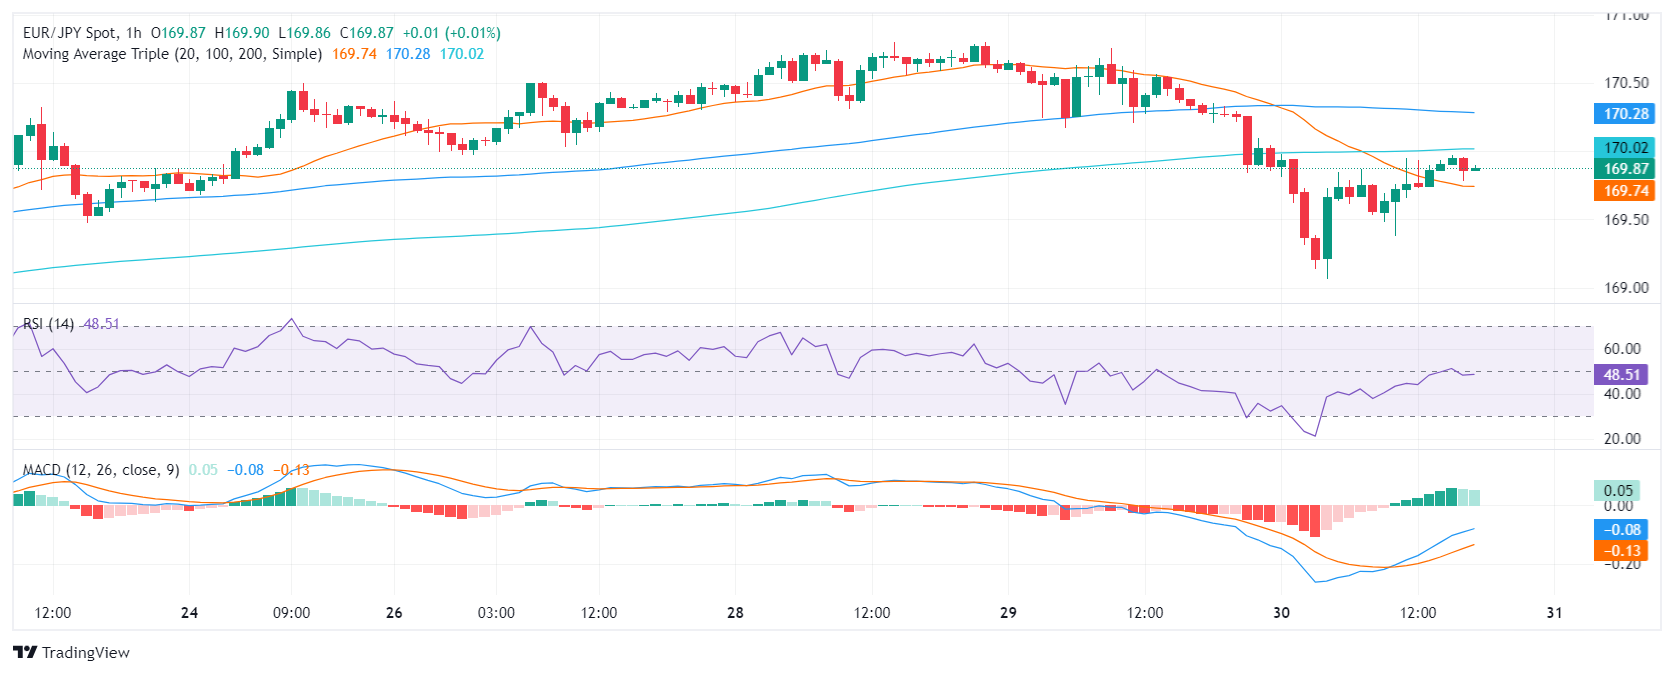
- On the hourly chart, indicators have flattened in the negative terrain, affirming an extended correction phase.
- The EUR/JPY's position above main SMAs continues to support a long-term bullish sentiment.
During Thursday's session, the EUR/JPY pair extended its correction to a daily low of 169.00 before stabilizing around 170.00. This indicates a continuation of the previous session's retreating bullish momentum. The main focus should be observed around the 170-169.00 range, anticipating further correction movements before confirming alterations to the trend.
In the daily analysis, the Relative Strength Index (RSI) and the Moving Average Convergence Divergence (MACD) point toward a deeper correction phase. The RSI is pointing downwards near 70 while the MACD has printed a fresh red bar. Both reflect the curbed bullish trend leading to a consolidation phase.
EUR/JPY daily chart
On the hourly chart, indicators have flattened in the negative area. This signals a reinforcing of the ongoing correction phase, likely a response to recent gains.
EUR/JPY hourly chart
Significantly, the current position of the EUR/JPY pair above the 20-day SMA at 168.70, although being tested, keeps the near-term bullish sentiment intact. Movements below this might fundamentally shift the bullish scenario. Below this market point, the 100 and 200-day SMA provide extra safety barriers for potential sellers.


© 2000-2026. All rights reserved.
This site is managed by Teletrade D.J. LLC 2351 LLC 2022 (Euro House, Richmond Hill Road, Kingstown, VC0100, St. Vincent and the Grenadines).
The information on this website is for informational purposes only and does not constitute any investment advice.
The company does not serve or provide services to customers who are residents of the US, Canada, Iran, The Democratic People's Republic of Korea, Yemen and FATF blacklisted countries.
Making transactions on financial markets with marginal financial instruments opens up wide possibilities and allows investors who are willing to take risks to earn high profits, carrying a potentially high risk of losses at the same time. Therefore you should responsibly approach the issue of choosing the appropriate investment strategy, taking the available resources into account, before starting trading.
Use of the information: full or partial use of materials from this website must always be referenced to TeleTrade as the source of information. Use of the materials on the Internet must be accompanied by a hyperlink to teletrade.org. Automatic import of materials and information from this website is prohibited.
Please contact our PR department if you have any questions or need assistance at pr@teletrade.global.
transfers