- Analytics
- News and Tools
- Market News
- AUD/NZD gains ground on robust Australian data, markets digest NZ tax relief
AUD/NZD gains ground on robust Australian data, markets digest NZ tax relief
- The AUD/NZD rebounded to a high of 1.0840 after dipping to 1.0815 on Wednesday.
- Strong data from Australia following the report of hot inflation figures reported at the beginning of the week benefited the AUD.
- New Zealand's newly announced tax cut policy may delay the RBNZ's rate cuts.
The AUD/NZD was seen trading higher during Thursday's session as markets digested mid-tier Australian data and a fresh fiscal policy from New Zealand.
In Australia, the robust Q1 business investment and higher-than-expected private capital expenditure figures supported the AUD. On Tuesday, the country reported higher-than-expected inflation figures which coupled with strong economic data may prompt the Reserve Bank of Australia (RBA) to turn more hawkish. On Wednesday Gross Domestic Product (GDP) will be closely followed.
Simultaneously, New Zealand's new government announced an NZD 14.7 billion tax cut package for low and middle-income households. A more lax fiscal policy has softened expectations of imminent rate cuts by the Reserve Bank of New Zealand (RBNZ) which could eventually limit the losses for the Kiwi. The odds of a cut in November fell slightly but remain priced at around 70%.
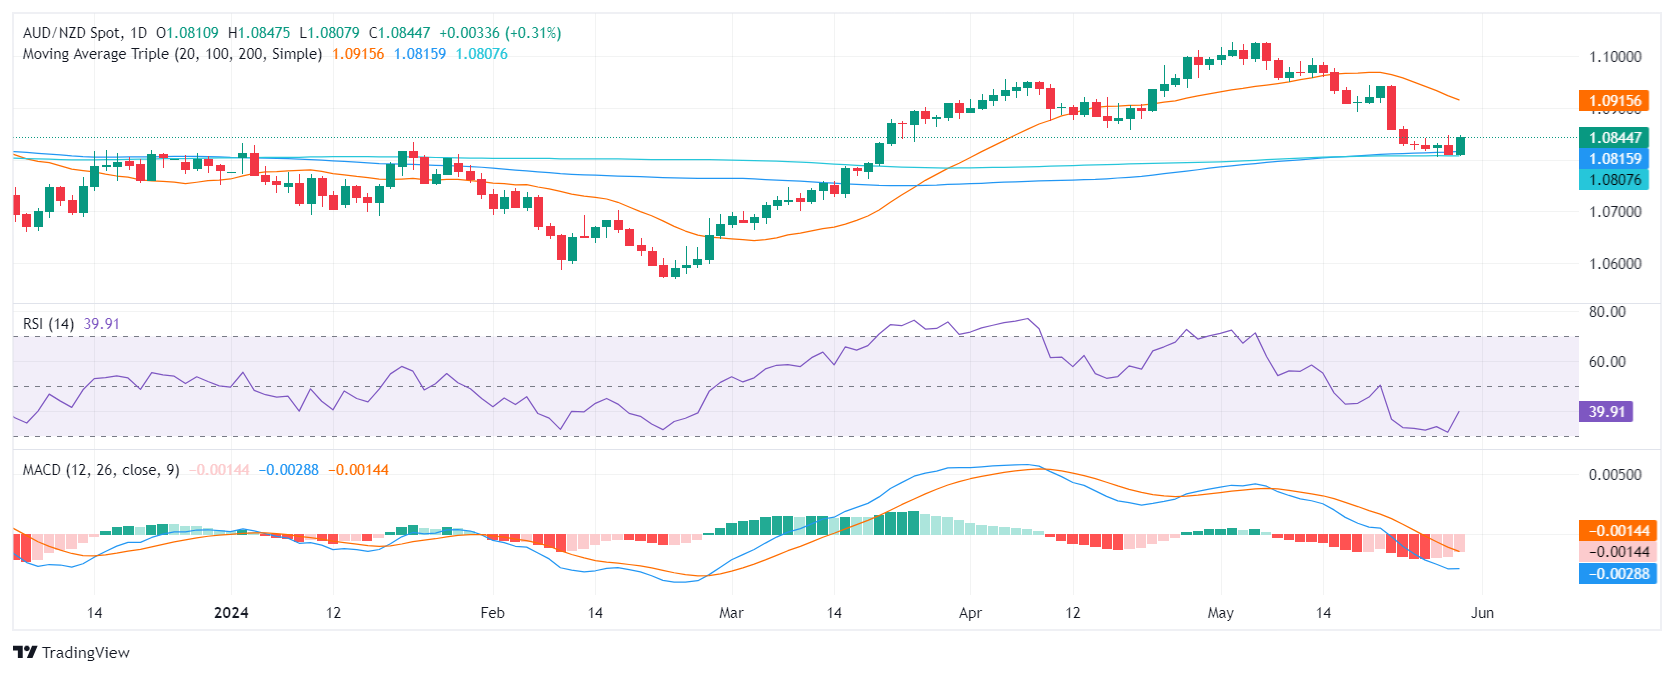
AUD/NZD technical analysis
On the daily chart, the Relative Strength Index (RSI) remains in negative territory, indicating a firm downtrend. The persistent rise of the red bars of the Moving Average Convergence Divergence (MACD) histogram further solidifies this downward momentum.
However, as the pair approached oversold territory on Wednesday indicators saw a slight upward correction on Thursday, which is in line with the latest market developments as sellers seem to be taking a breather.
AUD/NZD daily chart


© 2000-2026. All rights reserved.
This site is managed by Teletrade D.J. LLC 2351 LLC 2022 (Euro House, Richmond Hill Road, Kingstown, VC0100, St. Vincent and the Grenadines).
The information on this website is for informational purposes only and does not constitute any investment advice.
The company does not serve or provide services to customers who are residents of the US, Canada, Iran, The Democratic People's Republic of Korea, Yemen and FATF blacklisted countries.
Making transactions on financial markets with marginal financial instruments opens up wide possibilities and allows investors who are willing to take risks to earn high profits, carrying a potentially high risk of losses at the same time. Therefore you should responsibly approach the issue of choosing the appropriate investment strategy, taking the available resources into account, before starting trading.
Use of the information: full or partial use of materials from this website must always be referenced to TeleTrade as the source of information. Use of the materials on the Internet must be accompanied by a hyperlink to teletrade.org. Automatic import of materials and information from this website is prohibited.
Please contact our PR department if you have any questions or need assistance at pr@teletrade.global.
transfers