- Analytics
- News and Tools
- Market News
- AUD/JPY Price Analysis: Breaks below 104.00, followed by support at 14-day EMA
AUD/JPY Price Analysis: Breaks below 104.00, followed by support at 14-day EMA
- AUD/JPY could test the key level of 104.00, followed by the upper boundary of the ascending triangle.
- The momentum indicator 14-day RSI suggests the confirmation of the bullish bias for the pair.
- The immediate support appears around the 14-day EMA at 103.63 and the lower threshold of the ascending triangle.
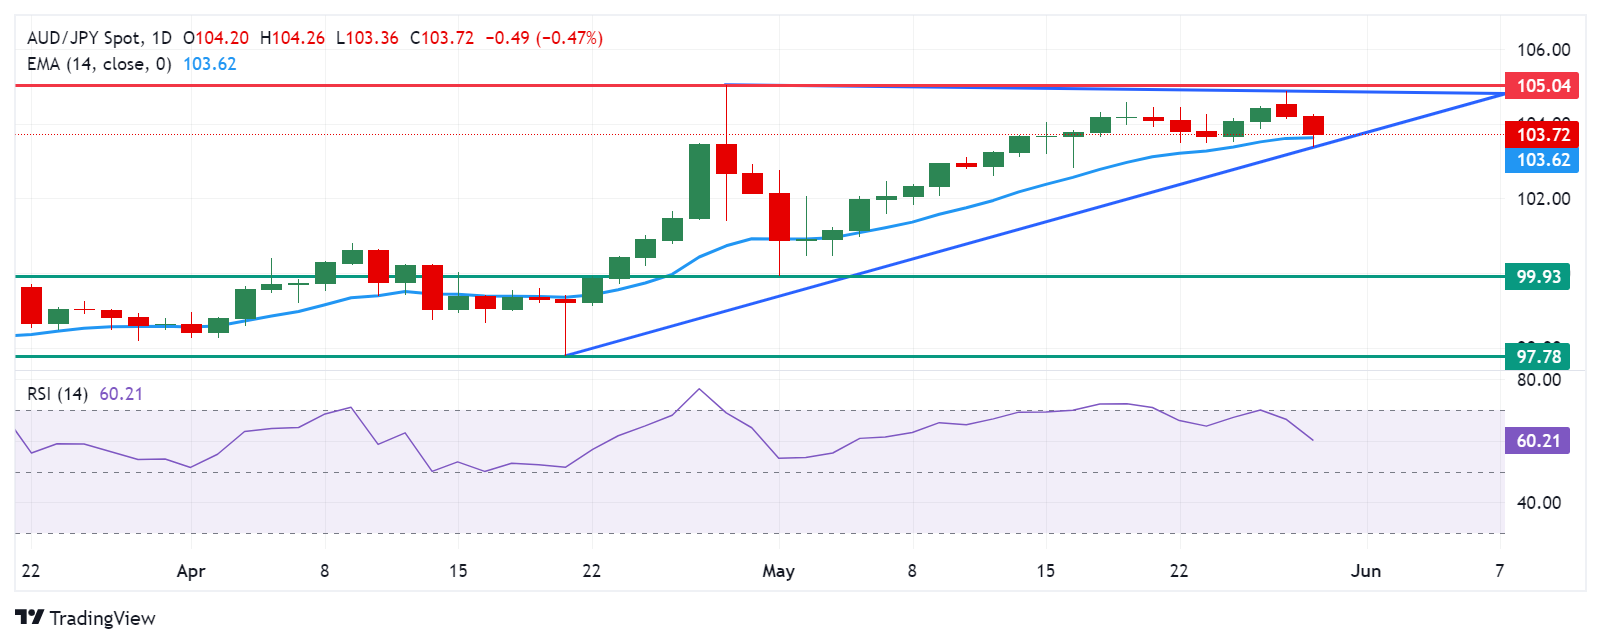
AUD/JPY extends its losses to near 103.80 during European trading hours on Thursday. However, the analysis of the daily chart indicates a bullish bias for the AUD/JPY pair, as it remains within an ascending triangle. Furthermore, the momentum indicator 14-day Relative Strength Index (RSI) is above the 50 level, suggesting confirmation of the bullish outlook.
The AUD/JPY cross could test the immediate resistance at the psychological level of 104.00, followed by the upper boundary of the ascending triangle around 104.80. A breakthrough above this level could reinforce the bullish sentiment, potentially pushing the cross past the psychological level of 105.00, aligning with the highest level of 105.04, which has not been seen since April 2013.
On the downside, the 14-day Exponential Moving Average (EMA) at 103.62 serves as immediate support for the AUD/JPY cross, followed by the lower threshold of the ascending triangle around the key level of 103.50.
A break below the latter could lead the AUD/JPY cross to navigate the region around the psychological level of 100.00 and the throwback support at 99.93. Further decline could exert downward pressure on the cross, potentially driving it toward April's low of 97.78.
AUD/JPY: Daily Chart


© 2000-2026. All rights reserved.
This site is managed by Teletrade D.J. LLC 2351 LLC 2022 (Euro House, Richmond Hill Road, Kingstown, VC0100, St. Vincent and the Grenadines).
The information on this website is for informational purposes only and does not constitute any investment advice.
The company does not serve or provide services to customers who are residents of the US, Canada, Iran, The Democratic People's Republic of Korea, Yemen and FATF blacklisted countries.
Making transactions on financial markets with marginal financial instruments opens up wide possibilities and allows investors who are willing to take risks to earn high profits, carrying a potentially high risk of losses at the same time. Therefore you should responsibly approach the issue of choosing the appropriate investment strategy, taking the available resources into account, before starting trading.
Use of the information: full or partial use of materials from this website must always be referenced to TeleTrade as the source of information. Use of the materials on the Internet must be accompanied by a hyperlink to teletrade.org. Automatic import of materials and information from this website is prohibited.
Please contact our PR department if you have any questions or need assistance at pr@teletrade.global.
transfers