- Analytics
- News and Tools
- Market News
- NZD/JPY Price Analysis: Bullish momentum adjusts, correction begins following overbought signals
NZD/JPY Price Analysis: Bullish momentum adjusts, correction begins following overbought signals
- The daily chart continues to flash overbought signals despite a slight correction, with the overall uptrend still intact.
- Despite a minor dip to 96.40, NZD/JPY remains near its multi-year peak.
- The critical support level for the pair remains firmly at 95.00, marking a pivotal level to ward off losses.
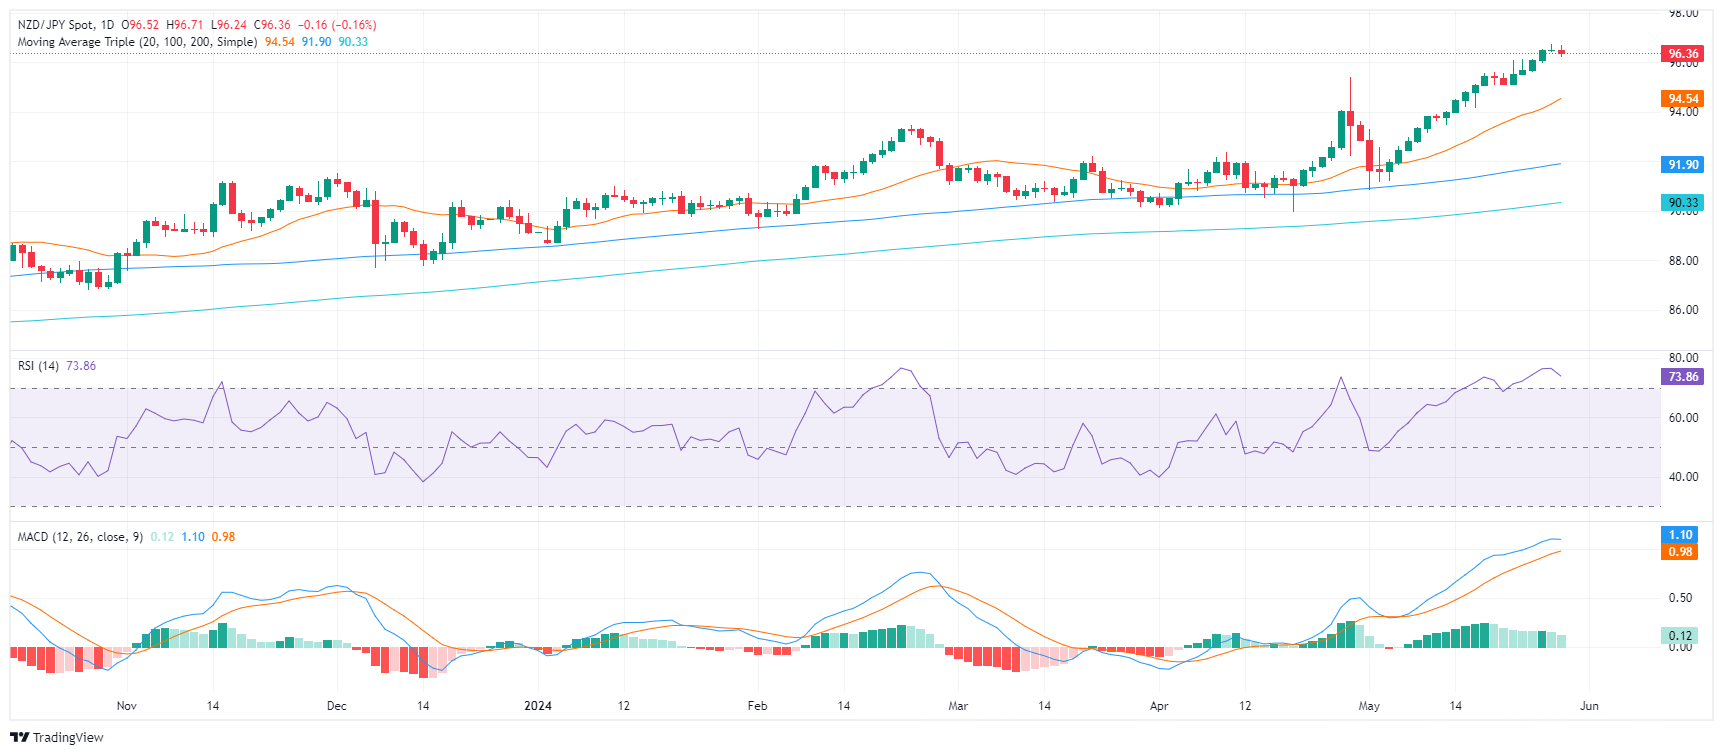
In Wednesday's session, the NZD/JPY pair saw a small correction to 96.40 but remains at its highest level since July 2007 at around 96.70. This adjustment doesn't quite alter the current outlook, merely turning it slightly cautious given the persistent overbought signals, but the overarching bullish trend carries on.
The daily chart's indicators confirm this narrative where the Relative Strength Index (RSI) remains in a deep overbought condition. Meanwhile, the Moving Average Convergence Divergence (MACD) keeps showing sustained positive momentum with its consistent green bars.
NZD/JPY daily chart
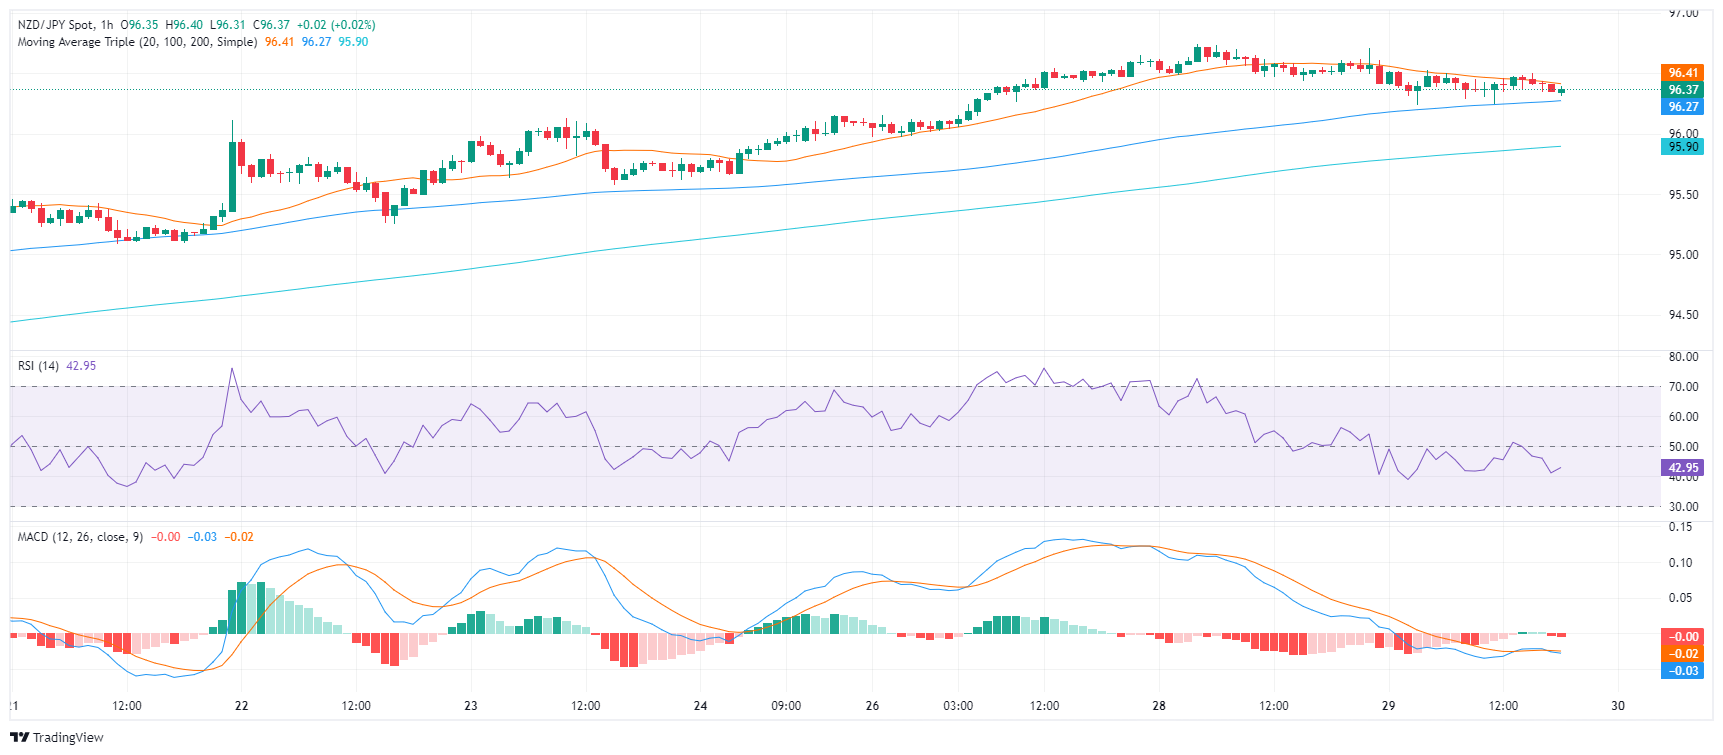
On the hourly chart, there is a visible weakening of strength compared to the daily perspective, and an ongoing edging downward can be observed.
NZD/JPY hourly chart
In a broader context, the NZD/JPY continues to display a strong uptrend, as shown by its position above the 20, 100, and 200-day Simple Moving Averages (SMA). Despite the slight correction, the pair's short-term gains still overshadow its medium and long-term averages.
As the looming correction gains momentum, any further downward movements should ideally keep the pair above its SMAs. Crucial to the monitoring is the first strong support level observed at 95.00, which the pair could potentially use to cushion any significant losses.


© 2000-2026. All rights reserved.
This site is managed by Teletrade D.J. LLC 2351 LLC 2022 (Euro House, Richmond Hill Road, Kingstown, VC0100, St. Vincent and the Grenadines).
The information on this website is for informational purposes only and does not constitute any investment advice.
The company does not serve or provide services to customers who are residents of the US, Canada, Iran, The Democratic People's Republic of Korea, Yemen and FATF blacklisted countries.
Making transactions on financial markets with marginal financial instruments opens up wide possibilities and allows investors who are willing to take risks to earn high profits, carrying a potentially high risk of losses at the same time. Therefore you should responsibly approach the issue of choosing the appropriate investment strategy, taking the available resources into account, before starting trading.
Use of the information: full or partial use of materials from this website must always be referenced to TeleTrade as the source of information. Use of the materials on the Internet must be accompanied by a hyperlink to teletrade.org. Automatic import of materials and information from this website is prohibited.
Please contact our PR department if you have any questions or need assistance at pr@teletrade.global.
transfers