- Analytics
- News and Tools
- Market News
- EUR/JPY Price Analysis: Consolidation phase imminent as bulls retreat
EUR/JPY Price Analysis: Consolidation phase imminent as bulls retreat
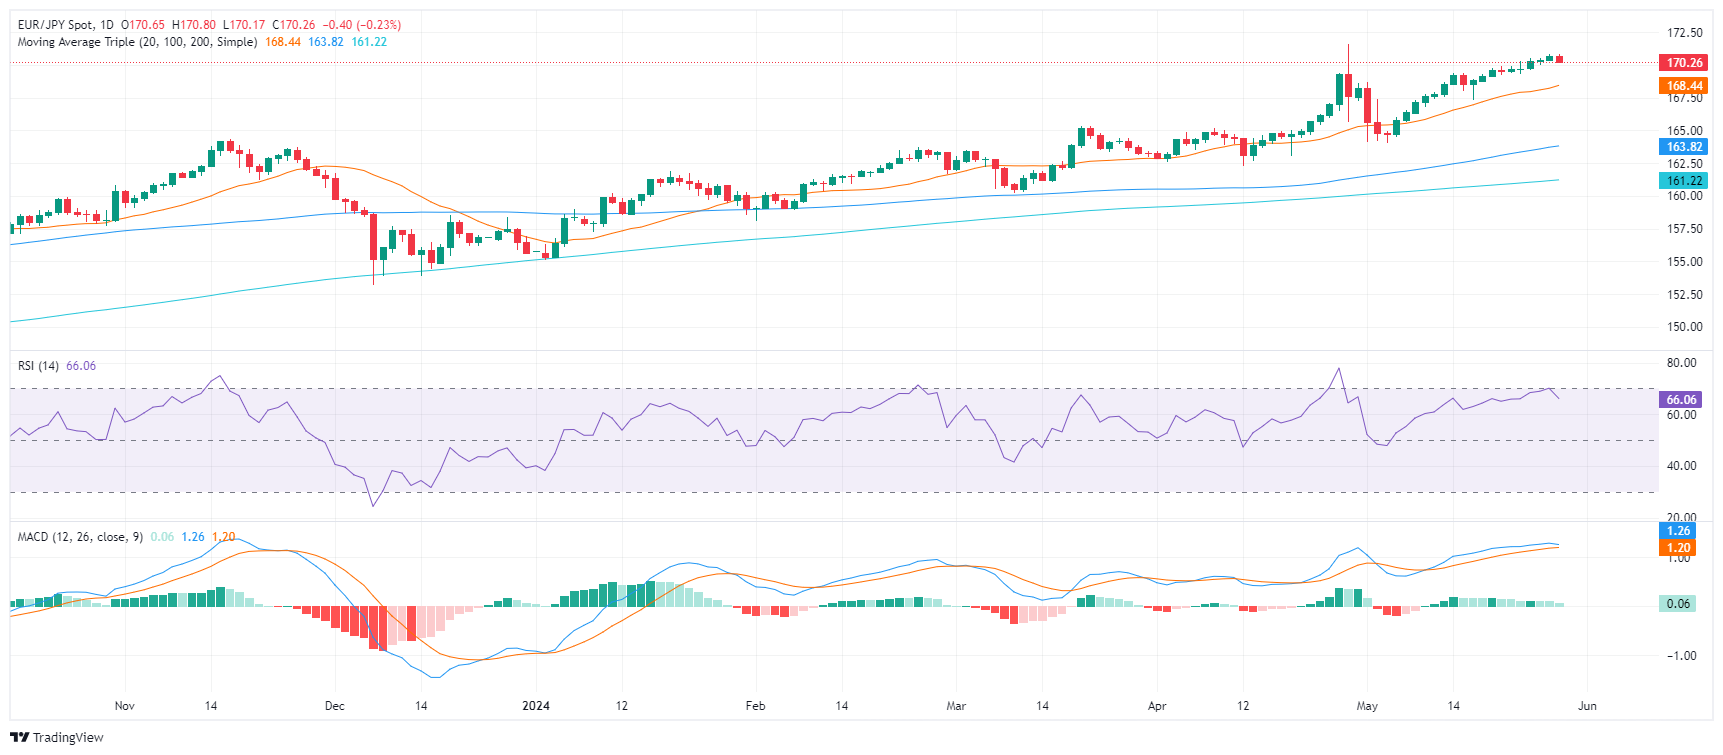
- The daily RSI and MACD are edging downwards but remain in positive territory hinting at a possible consolidation phase that could be brief.
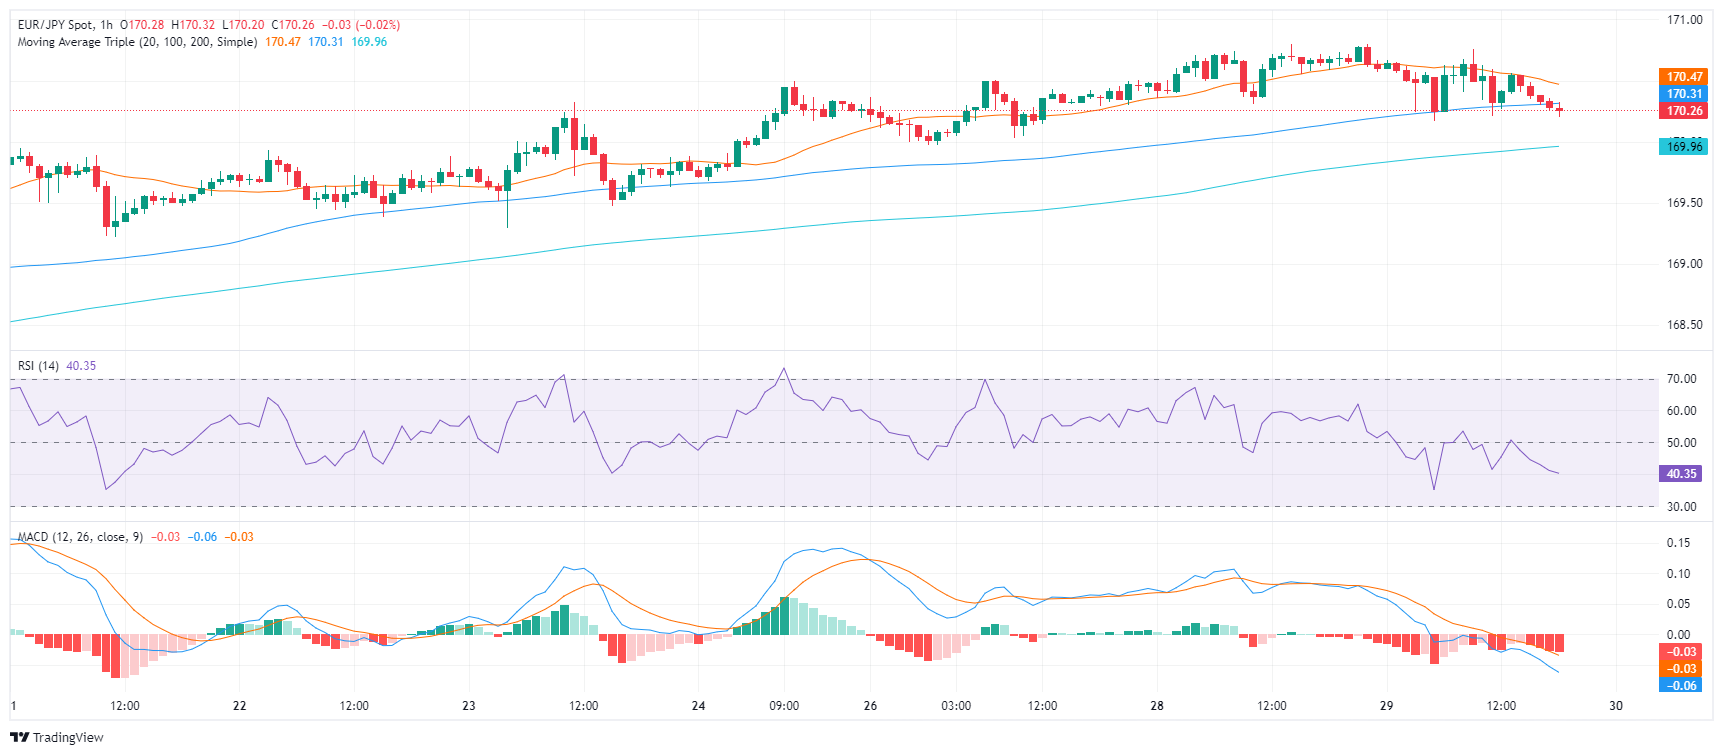
- On the hourly chart, indicators have shifted into the negative zone, further pointing towards an ongoing correction phase.
- The EUR/JPY's position above main SMAs keeps a long-term bullish sentiment alive despite the recent pullback.
In Wednesday's session, the EUR/JPY pair retreated slightly to 170.29, demonstrating an immediate dampening of the bullish momentum. However, since it remains close to cycle highs of 171.60, the consolidation period might not last long. Traders should observe the 170-168.00 range for potential correction movements before affirming changes to the outlook.
In the daily analysis, the Relative Strength Index (RSI) and the Moving Average Convergence Divergence (MACD) indicate a slight downward movement but still remain in the positive region. Both demonstrate the stopped short bullish trend which may lead to a short consolidation phase.
EUR/JPY daily chart
On the hourly chart, both RSI and MACD have now edged into the negative zone, corroborating with the indication of an ongoing corrective phase, which is likely response to recent gains.
EUR/JPY hourly chart
Notably, the current position of the EUR/JPY pair above the 20-day SMA at 168.45, though threatened, maintains the short-term bullish sentiment. Any movements below this could, however, fundamentally shift the bullish scenario. Below it, the 100 and 200-day SMA offer additional supportive barriers in case sellers come in strong.


© 2000-2026. All rights reserved.
This site is managed by Teletrade D.J. LLC 2351 LLC 2022 (Euro House, Richmond Hill Road, Kingstown, VC0100, St. Vincent and the Grenadines).
The information on this website is for informational purposes only and does not constitute any investment advice.
The company does not serve or provide services to customers who are residents of the US, Canada, Iran, The Democratic People's Republic of Korea, Yemen and FATF blacklisted countries.
Making transactions on financial markets with marginal financial instruments opens up wide possibilities and allows investors who are willing to take risks to earn high profits, carrying a potentially high risk of losses at the same time. Therefore you should responsibly approach the issue of choosing the appropriate investment strategy, taking the available resources into account, before starting trading.
Use of the information: full or partial use of materials from this website must always be referenced to TeleTrade as the source of information. Use of the materials on the Internet must be accompanied by a hyperlink to teletrade.org. Automatic import of materials and information from this website is prohibited.
Please contact our PR department if you have any questions or need assistance at pr@teletrade.global.
transfers