- Analytics
- News and Tools
- Market News
- AUD/NZD declines following higher inflation figures from Australia and soft ANZ data
AUD/NZD declines following higher inflation figures from Australia and soft ANZ data
- The AUD/NZD declines to a low of 1.0815 after reaching a high of 1.0850 on Wednesday.
- Australian high-tier data tempers RBA's dovish expectations, while soft New Zealand data renews RBNZ policy divergence.
- Following downbeat ANZ data, the market bets over higher odds of an RBNZ rate cut in November.
The AUD/NZD was seen trading lower during Wednesday's trading session, as markets digest high-tier data from both Australia and New Zealand.
In Australia, April's Consumer Price Indxe (CPI) came in hot at 3.6% YoY, surpassing the 3.4% expectations and the previous month's 3.5%. This marked the second consecutive month of acceleration and is the highest inflation rate since November. With core inflation remaining sticky above 4%, there are strong signals that the Reserve Bank of Australia (RBA) might turn its tone to a more hawkish one.
Meanwhile, the disappointing ANZ business survey data for May became a focal point in New Zealand. The Own Activity Outlook index dropped to a low of 11.8 from 14.3 in April, hinting towards weaker growth. Recently sticky domestic inflation led to the RBNZ discussing a potential rate increase which led to a significant strengthening of the Kiwi, markets are betting that the first cut will come in November of this year, priced in by 65%.
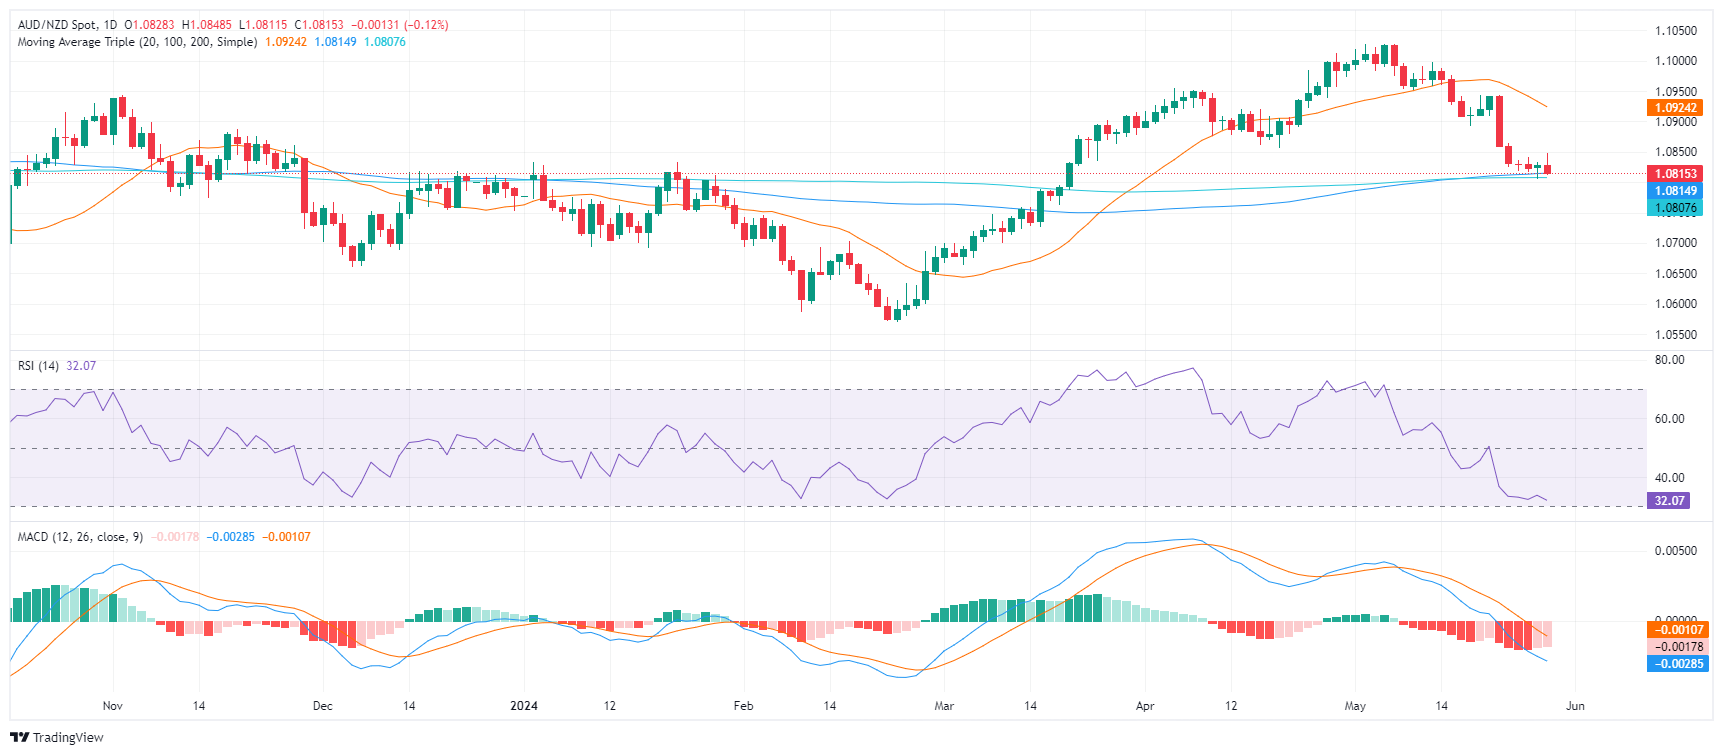
AUD/NZD technical analysis
On the daily chart, the Relative Strength Index (RSI) remains in negative territory, indicating a robust downtrend. This is consolidated by the rising red bars of the Moving Average Convergence Divergence (MACD) histogram, which confirms the continued downward momentum.
That being said, as the pair approached oversold terrain, the pair may see a slight upward correction in the next sessions.
AUD/NZD daily chart


© 2000-2026. All rights reserved.
This site is managed by Teletrade D.J. LLC 2351 LLC 2022 (Euro House, Richmond Hill Road, Kingstown, VC0100, St. Vincent and the Grenadines).
The information on this website is for informational purposes only and does not constitute any investment advice.
The company does not serve or provide services to customers who are residents of the US, Canada, Iran, The Democratic People's Republic of Korea, Yemen and FATF blacklisted countries.
Making transactions on financial markets with marginal financial instruments opens up wide possibilities and allows investors who are willing to take risks to earn high profits, carrying a potentially high risk of losses at the same time. Therefore you should responsibly approach the issue of choosing the appropriate investment strategy, taking the available resources into account, before starting trading.
Use of the information: full or partial use of materials from this website must always be referenced to TeleTrade as the source of information. Use of the materials on the Internet must be accompanied by a hyperlink to teletrade.org. Automatic import of materials and information from this website is prohibited.
Please contact our PR department if you have any questions or need assistance at pr@teletrade.global.
transfers