- Analytics
- News and Tools
- Market News
- GBP/USD Price Analysis: Slumps to fresh weekly lows as bears eye 1.2700
GBP/USD Price Analysis: Slumps to fresh weekly lows as bears eye 1.2700
- GBP/USD tumbles to new three-day low as ‘evening star’ chart pattern emerges.
- Buyers’ momentum begins to fade as RSI aims toward the 50-midline.
- If the pair drops below 1.2700, look for further losses; otherwise, bulls can challenge 1.2800.
The British Pound fell to a new weekly low against the Greenback on Wednesday as US Treasury bond yields continued to climb. Federal Reserve officials remained cautious and influenced traders' expectations of just 25 basis points of rate cuts seen toward the end of 2024. The GBP/USD trades at 1.2719, down 0.33%.
GBP/USD Price Analysis: Technical outlook
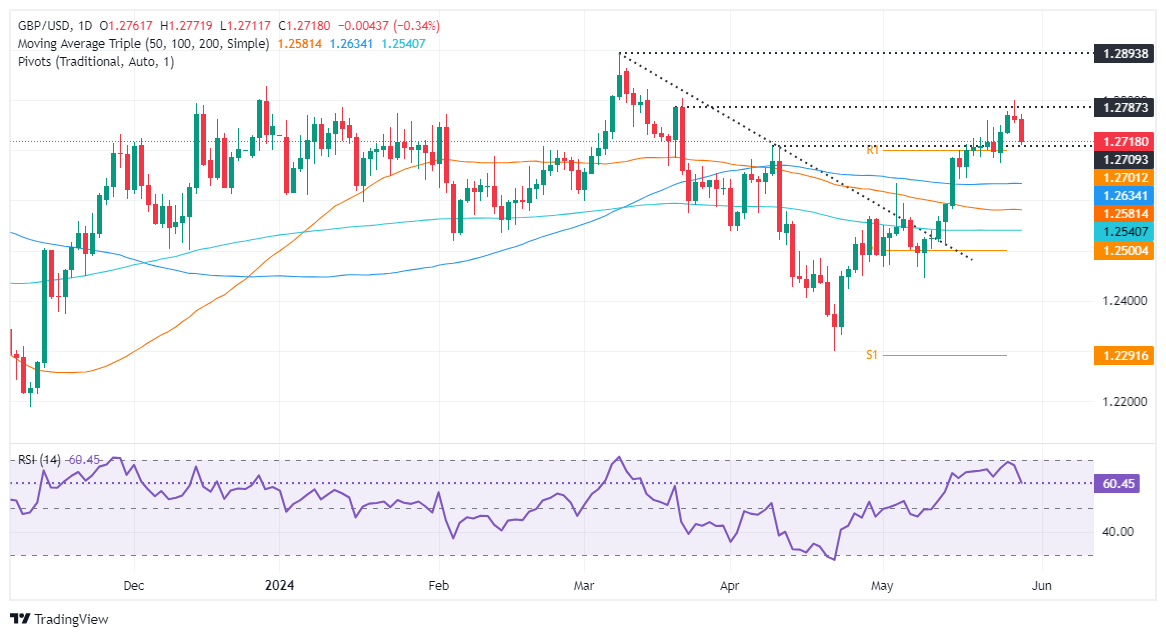
The GBP/USD formed a three-candle chart formation called an ‘evening star,’ hinting that prices could tumble further. Momentum remains bullish, as depicted by the Relative Strength Index (RSI), but aims toward the 50-midline, which means that buyers are losing momentum.
On further weakness, if GBP/USD drops below 1.2700, the pair could test the May 3 daily high turned support at 1.2634. Once cleared, the next support would be the 50-day moving average (DMA) at 1.2580, followed by the 200-DMA at 1.2539.
On the other hand, if buyers reclaim the current week's high of 1.2777, further gains are seen above 1.2800, like the year-to-date (YTD) high of 1.2893.
GBP/USD Price Action – Daily Chart
British Pound PRICE Today
The table below shows the percentage change of British Pound (GBP) against listed major currencies today. British Pound was the strongest against the Australian Dollar.
| USD | EUR | GBP | JPY | CAD | AUD | NZD | CHF | |
|---|---|---|---|---|---|---|---|---|
| USD | 0.33% | 0.33% | 0.13% | 0.34% | 0.40% | 0.27% | 0.05% | |
| EUR | -0.33% | -0.01% | -0.22% | 0.00% | 0.06% | -0.06% | -0.28% | |
| GBP | -0.33% | 0.00% | -0.22% | -0.02% | 0.05% | -0.05% | -0.29% | |
| JPY | -0.13% | 0.22% | 0.22% | 0.20% | 0.27% | 0.15% | -0.10% | |
| CAD | -0.34% | -0.00% | 0.02% | -0.20% | 0.07% | -0.05% | -0.30% | |
| AUD | -0.40% | -0.06% | -0.05% | -0.27% | -0.07% | -0.11% | -0.34% | |
| NZD | -0.27% | 0.06% | 0.05% | -0.15% | 0.05% | 0.11% | -0.25% | |
| CHF | -0.05% | 0.28% | 0.29% | 0.10% | 0.30% | 0.34% | 0.25% |
The heat map shows percentage changes of major currencies against each other. The base currency is picked from the left column, while the quote currency is picked from the top row. For example, if you pick the British Pound from the left column and move along the horizontal line to the US Dollar, the percentage change displayed in the box will represent GBP (base)/USD (quote).


© 2000-2026. All rights reserved.
This site is managed by Teletrade D.J. LLC 2351 LLC 2022 (Euro House, Richmond Hill Road, Kingstown, VC0100, St. Vincent and the Grenadines).
The information on this website is for informational purposes only and does not constitute any investment advice.
The company does not serve or provide services to customers who are residents of the US, Canada, Iran, The Democratic People's Republic of Korea, Yemen and FATF blacklisted countries.
Making transactions on financial markets with marginal financial instruments opens up wide possibilities and allows investors who are willing to take risks to earn high profits, carrying a potentially high risk of losses at the same time. Therefore you should responsibly approach the issue of choosing the appropriate investment strategy, taking the available resources into account, before starting trading.
Use of the information: full or partial use of materials from this website must always be referenced to TeleTrade as the source of information. Use of the materials on the Internet must be accompanied by a hyperlink to teletrade.org. Automatic import of materials and information from this website is prohibited.
Please contact our PR department if you have any questions or need assistance at pr@teletrade.global.
transfers