- Analytics
- News and Tools
- Market News
- EUR/USD Price Analysis: Moves below 1.0850 despite a bullish bias
EUR/USD Price Analysis: Moves below 1.0850 despite a bullish bias
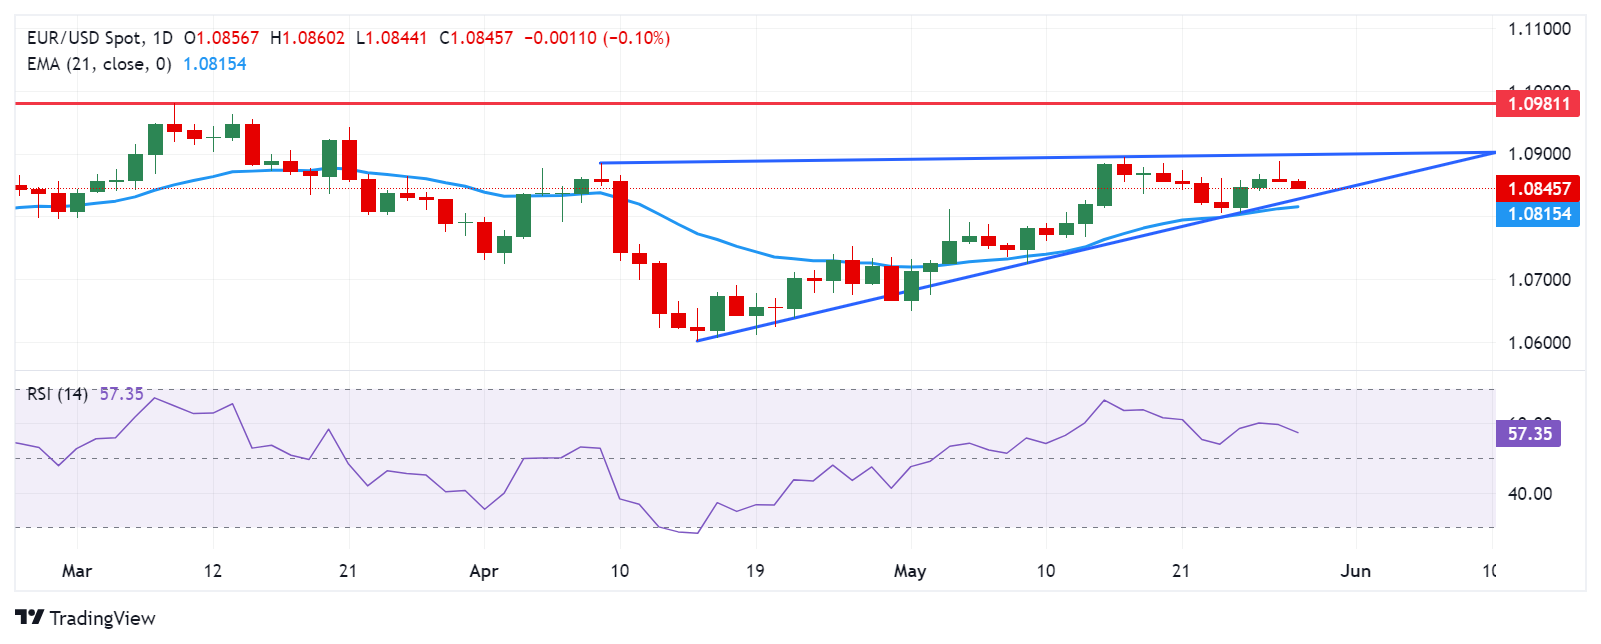
- EUR/USD consolidates within the ascending triangle, indicating a bullish bias.
- The upper boundary of the ascending triangle and the psychological level of 1.0900 appear to be key resistance levels.
- The pair could test the lower boundary of the ascending triangle, followed by the 21-day EMA at 1.0815.
EUR/USD extended losses to near 1.0850 during the Asian session on Wednesday. The pair faces challenges as the US Dollar (USD) gains ground amidst emerging risk aversion sentiment, possibly triggered by hawkish remarks from Minneapolis Fed President Neel Kashkari. Kashkari's comments suggest that rate increases are still a possibility and express uncertainty about the disinflationary process, with a prediction of only two rate cuts.
However, an analysis of the daily chart indicates a bullish bias for the EUR/USD pair, as it consolidates within an ascending triangle. Additionally, the 14-day Relative Strength Index (RSI) momentum indicator is slightly above the 50 level, further supporting this bullish bias.
The EUR/USD pair could potentially challenge the upper boundary of the ascending triangle, followed by the psychological resistance level at 1.0900. Breaking above this level could lead the pair toward the region around the significant level of 1.0950, followed by a three-month high of 1.0981.
On the downside, immediate support for the EUR/USD pair could be found at the lower boundary of the ascending triangle, followed by the 21-day Exponential Moving Average (EMA) at 1.0815. A breach below the psychological level of 1.0800 might exert downward pressure, potentially navigating toward the area around the significant level of 1.0700.
EUR/USD: Daily Chart


© 2000-2026. All rights reserved.
This site is managed by Teletrade D.J. LLC 2351 LLC 2022 (Euro House, Richmond Hill Road, Kingstown, VC0100, St. Vincent and the Grenadines).
The information on this website is for informational purposes only and does not constitute any investment advice.
The company does not serve or provide services to customers who are residents of the US, Canada, Iran, The Democratic People's Republic of Korea, Yemen and FATF blacklisted countries.
Making transactions on financial markets with marginal financial instruments opens up wide possibilities and allows investors who are willing to take risks to earn high profits, carrying a potentially high risk of losses at the same time. Therefore you should responsibly approach the issue of choosing the appropriate investment strategy, taking the available resources into account, before starting trading.
Use of the information: full or partial use of materials from this website must always be referenced to TeleTrade as the source of information. Use of the materials on the Internet must be accompanied by a hyperlink to teletrade.org. Automatic import of materials and information from this website is prohibited.
Please contact our PR department if you have any questions or need assistance at pr@teletrade.global.
transfers