- Analytics
- News and Tools
- Market News
- NZD/USD flattens out near 0.6140 after testing 11-week high
NZD/USD flattens out near 0.6140 after testing 11-week high
- Easing Greenback pressure gives Kiwi another leg into fresh highs.
- Momentum remains thin as NZD rtaders grapple with a lack of data.
- US GDP, PCE inflation prints to dominate the last half of the trading week.
NZD/USD eased back into the 0.6140 level in early Wednesday trading as Kiwi traders await a reason to move. The economic calendar is notably thin except for the NZ government’s latest Budget Release on Thursday, leaving NZD traders adrift until Friday’s speech from Reserve Bank of New Zealand (RBNZ) Governor Orr.
US data in the back half of the trading week will drive investor sentiment with an update to US quarterly Gross Domestic Product (GDP) and the latest print of Personal Consumption Expenditure (PCE) Price Index inflation.
Investors have been awaiting signs of movement from the Federal Reserve (Fed) on rate cuts, with markets broadly keeping an eye on a flurry of appearances from Fed officials in the early week. Broad-market hopes for rate cuts continue to wither against a cautious Fed, and rate markets are pricing in roughly even odds of a quarter-point rate trim from the Federal Open Market Committee (FOMC) in September.
NZD/USD technical outlook
The Kiwi is drifting into the high side against the Greenback this week, and the pair has closed in the green for four consecutive trading weeks. Despite recent upswings, the pair is hitting technical consolidation just north of the 200-day Exponential Moving Average (EMA) at 0.6070.
Bullish momentum may be hitting a wall on the NZD/USD with the Moving Average Convergence-Divergence (MACD) signal lines running far ahead of bullish histogram bars, implying buying pressure may be poised for a reversal.
NZD/USD daily chart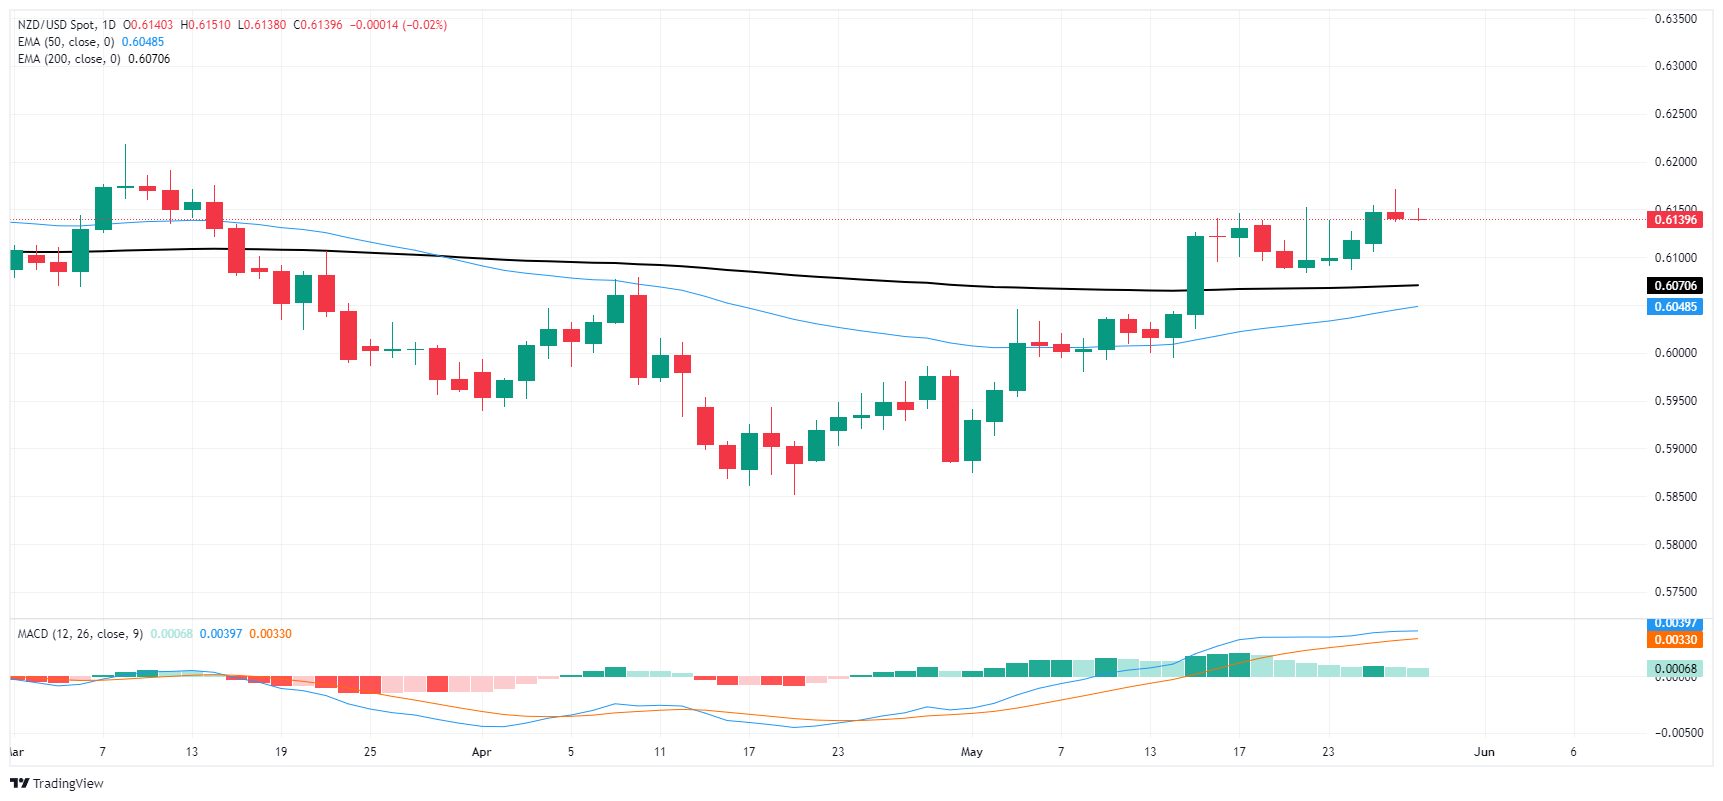


© 2000-2026. All rights reserved.
This site is managed by Teletrade D.J. LLC 2351 LLC 2022 (Euro House, Richmond Hill Road, Kingstown, VC0100, St. Vincent and the Grenadines).
The information on this website is for informational purposes only and does not constitute any investment advice.
The company does not serve or provide services to customers who are residents of the US, Canada, Iran, The Democratic People's Republic of Korea, Yemen and FATF blacklisted countries.
Making transactions on financial markets with marginal financial instruments opens up wide possibilities and allows investors who are willing to take risks to earn high profits, carrying a potentially high risk of losses at the same time. Therefore you should responsibly approach the issue of choosing the appropriate investment strategy, taking the available resources into account, before starting trading.
Use of the information: full or partial use of materials from this website must always be referenced to TeleTrade as the source of information. Use of the materials on the Internet must be accompanied by a hyperlink to teletrade.org. Automatic import of materials and information from this website is prohibited.
Please contact our PR department if you have any questions or need assistance at pr@teletrade.global.
transfers