- Analytics
- News and Tools
- Market News
- AUD/JPY Price Analysis: Bulls display signs of fatigue, potential shift remains possible
AUD/JPY Price Analysis: Bulls display signs of fatigue, potential shift remains possible
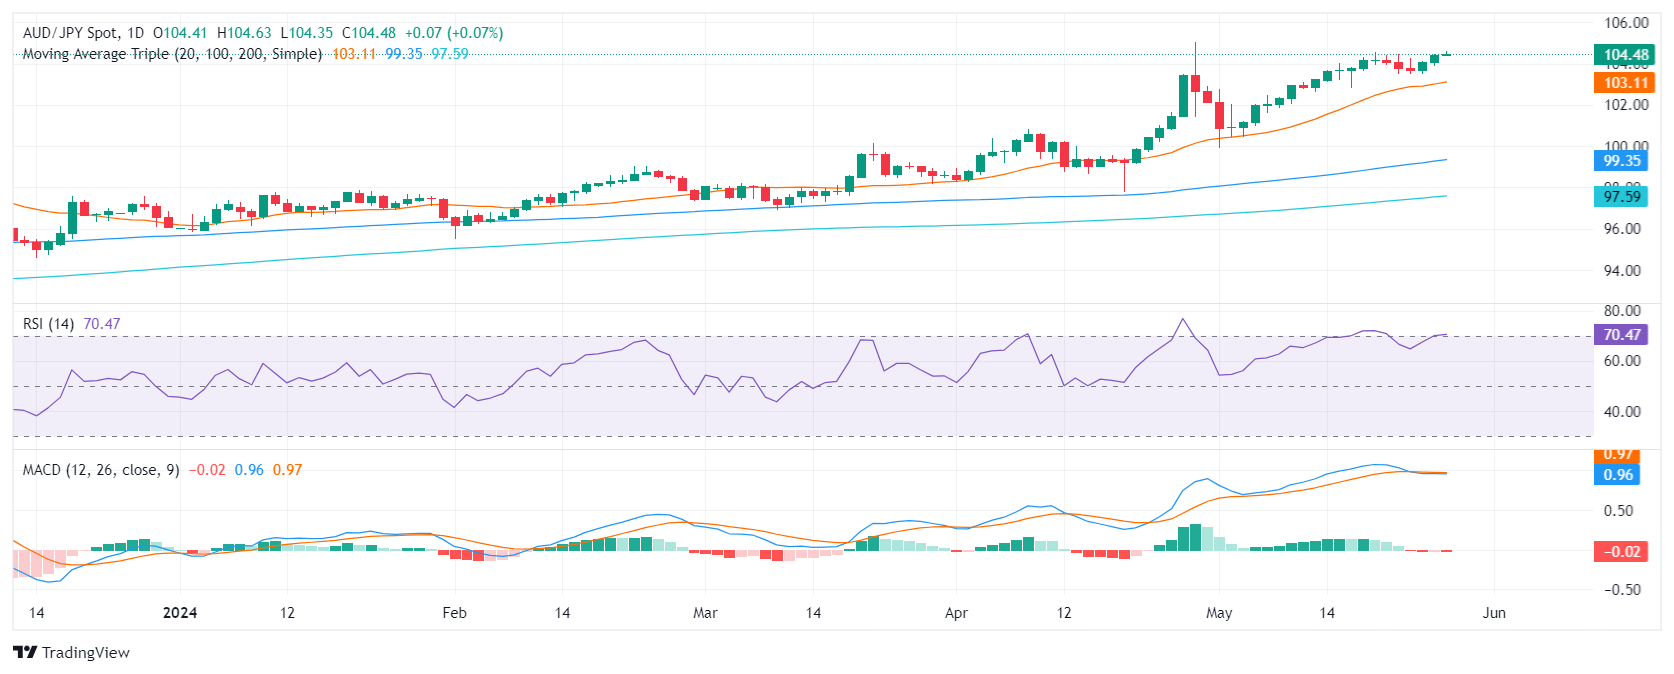
- Daily chart indicators suggest a slowdown in buying traction with RSI positioned above 70 indicating overbought conditions.
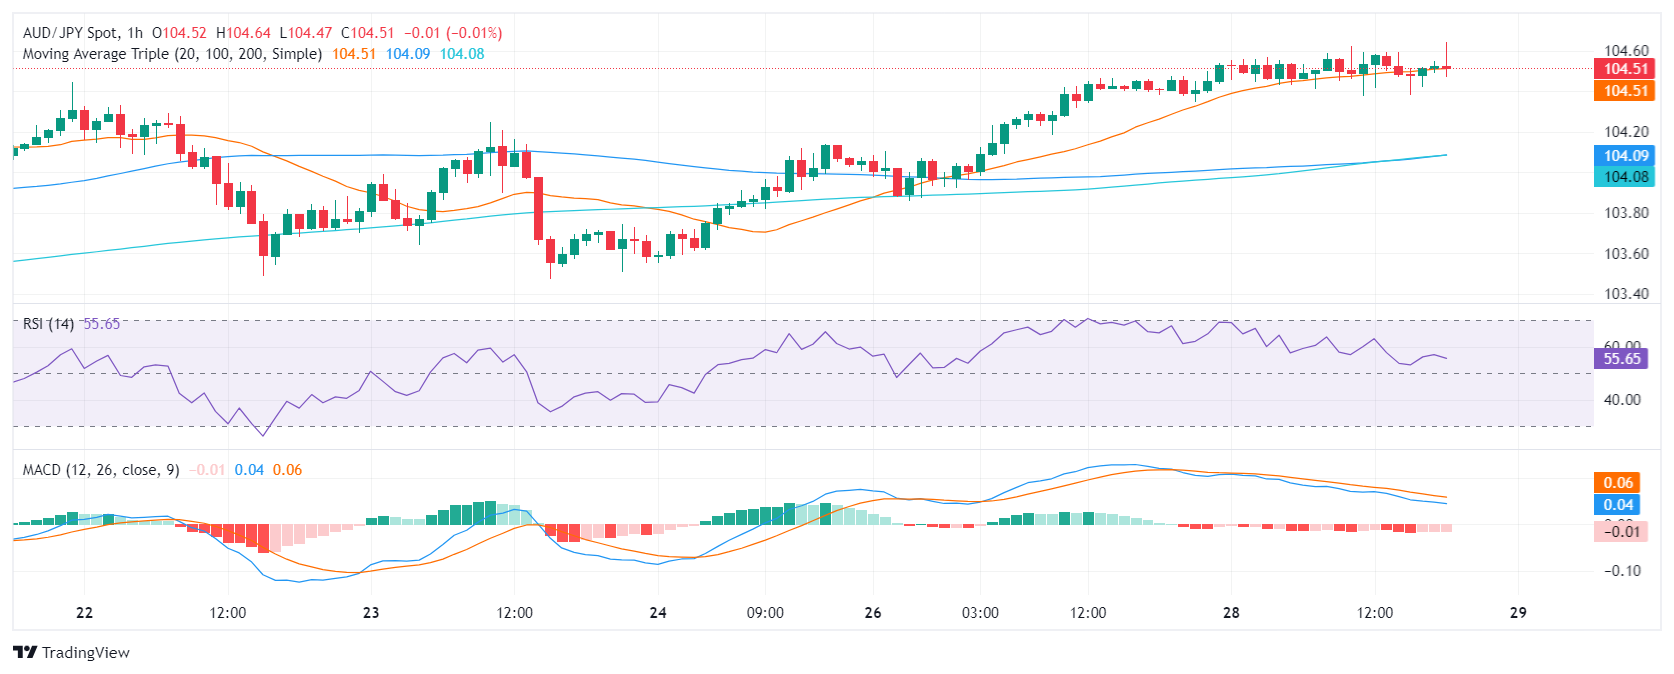
- Hourly chart indicators weaken, implying the possibility of short-term losses in the upcoming Asian session.
- The bulls might not have enough traction to retest the cycle highs above 105.00.
In Tuesday's session, the AUD/JPY pair continued to edge higher, securing some gains but at a seemingly slower pace, stabilizing around the 104.60 mark. Given the extended upward phase with 15 gains out of the last 19 sessions, buyers may be showing signs of fatigue. The market could be heading towards a short-term correction as indicators flash overbought signals.
On the daily chart, the RSI has inched above the 70 territory, an area typically considered overbought. This situation, along with the MACD producing red bars, suggests that while buyers still hold control, their grip is loosening.
AUD/JPY daily chart
The hourly chart portrays similar sentiments. The RSI is nearing 50 and displays a downward bias. Concurrently, the MACD prints rising red bars, hinting at a weakening bullish momentum in the near term.
AUD/JPY hourly chart
Zooming out for the big picture, the AUD/JPY continues to trade above all three key Simple Moving Average (SMA) benchmarks of 20, 100, and 200 days, affirming a bullish perspective. However, with the pair stabilizing around multi-year highs, and overt signs of buyer exhaustion, the possibility of a near-term correction is becoming increasingly apparent. The main resistance is the cycle high just above 105.00 while the 20-day SMA at 103.12 offers itself as a strong support.


© 2000-2026. All rights reserved.
This site is managed by Teletrade D.J. LLC 2351 LLC 2022 (Euro House, Richmond Hill Road, Kingstown, VC0100, St. Vincent and the Grenadines).
The information on this website is for informational purposes only and does not constitute any investment advice.
The company does not serve or provide services to customers who are residents of the US, Canada, Iran, The Democratic People's Republic of Korea, Yemen and FATF blacklisted countries.
Making transactions on financial markets with marginal financial instruments opens up wide possibilities and allows investors who are willing to take risks to earn high profits, carrying a potentially high risk of losses at the same time. Therefore you should responsibly approach the issue of choosing the appropriate investment strategy, taking the available resources into account, before starting trading.
Use of the information: full or partial use of materials from this website must always be referenced to TeleTrade as the source of information. Use of the materials on the Internet must be accompanied by a hyperlink to teletrade.org. Automatic import of materials and information from this website is prohibited.
Please contact our PR department if you have any questions or need assistance at pr@teletrade.global.
transfers