- Analytics
- News and Tools
- Market News
- GBP/JPY breaks into fresh multi-decade highs as Yen continues to soften
GBP/JPY breaks into fresh multi-decade highs as Yen continues to soften
- GBP/JPY breached 200.60, setting a fresh 34-year high.
- Thin UK data leaves GBP free to drift higher against the Yen.
- Japanes Tokyo CPI inflation due on Friday.
GBP/JPY drifted into a new 34-year high above 200.60 on Tuesday as Yen pairs continue to pare away JPY strength following suspected “Yenterventions” from the Bank of Japan (BoJ) and Japanese Minstry of Finance who overspent nine trillion Yen on miscellaneous financial operations and is broadly assumed to have intervened directly in global markets in an attempt to shore up the battered Yen.
No official statement from the BoJ or the Ministry has been forthcoming, but markets are challenging Japanese planners and shorting the Yen back into multi-decade lows. The Guppy hit its highest bids in 34 years as the wide rate differential between the BoJ and other central banks including the Bank of England (BoE) remains simply too high for markets to bolster the JPY.
The key datapoint for the GBP/JPY this week will be Japan’s Tokyo Consumer Price Index (CPI) inflation update due on Thursday. Core Tokyo CPI for the year ended in May is expected to tick higher to 1.9% from 1.6%. Headline Tokyo CPI inflation last printed at 1.8% in April.
Markets remain unsure of when the BoE will deliver much-hoped for rate cuts. Previous hopes for a June rate cut have evaporated, and investors are looking for signs that the BoE will make a first rate trim in September.
GBP/JPY technical outlook
The Guppy has traded entirely one-sided since drooping to a near-term low near 191.50. The pair has 4.8% since the beginning of May, and is poised for further gains into multi-decade highs.
GBP/JPY is up over 12% after knocking into the 200-day Exponential Moving Average (EMA) at the beginning of 2024. The pair has closed in the green for all but three of the last 16 consecutive trading days.
GBP/JPY hourly chart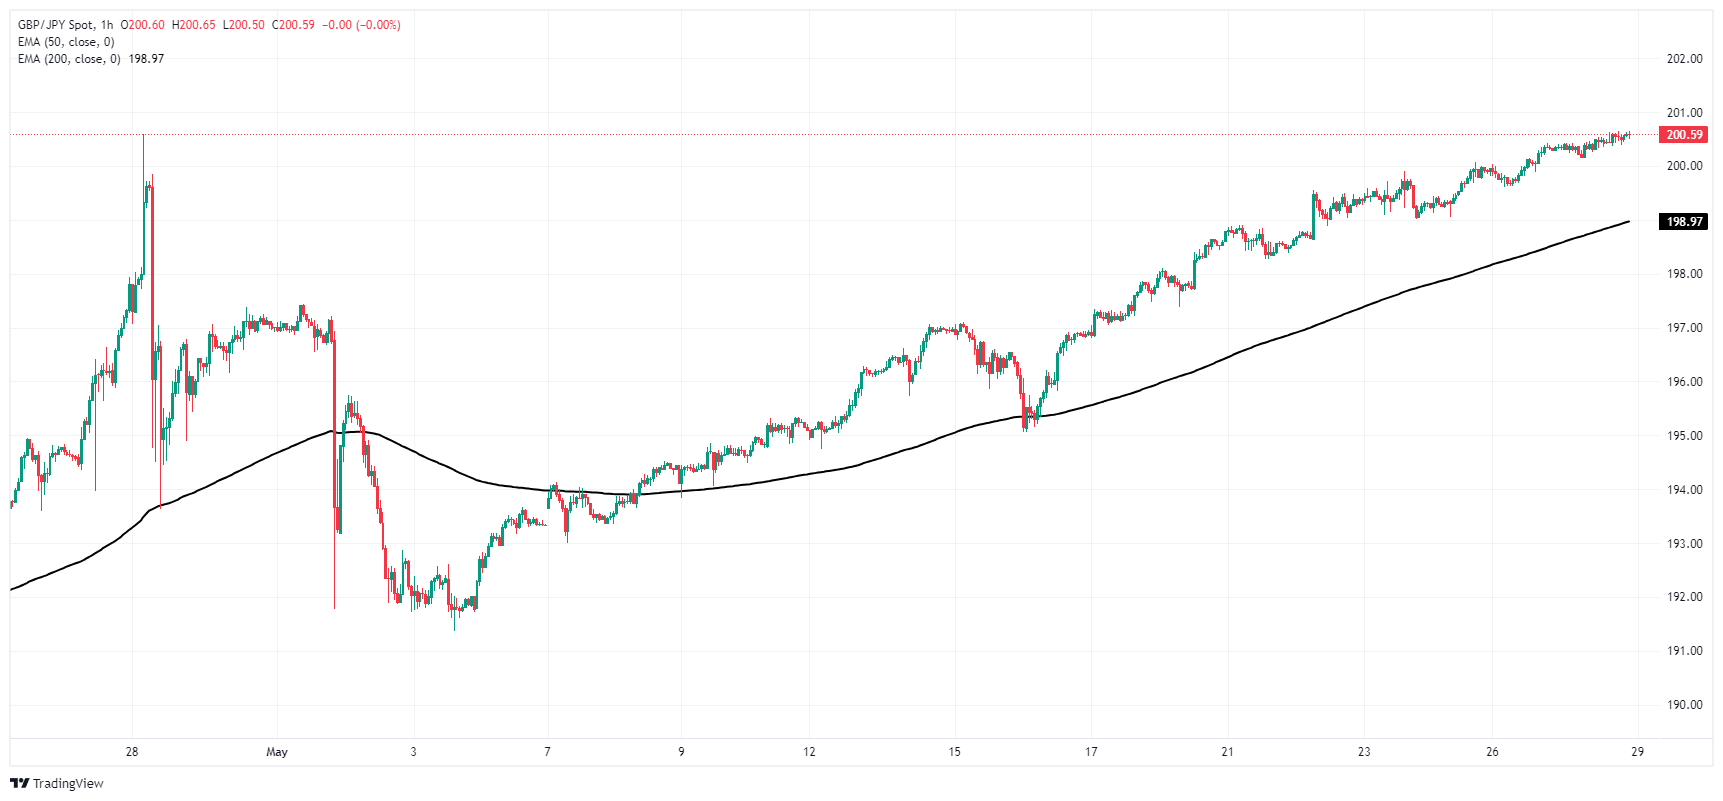
GBP/JPY daily chart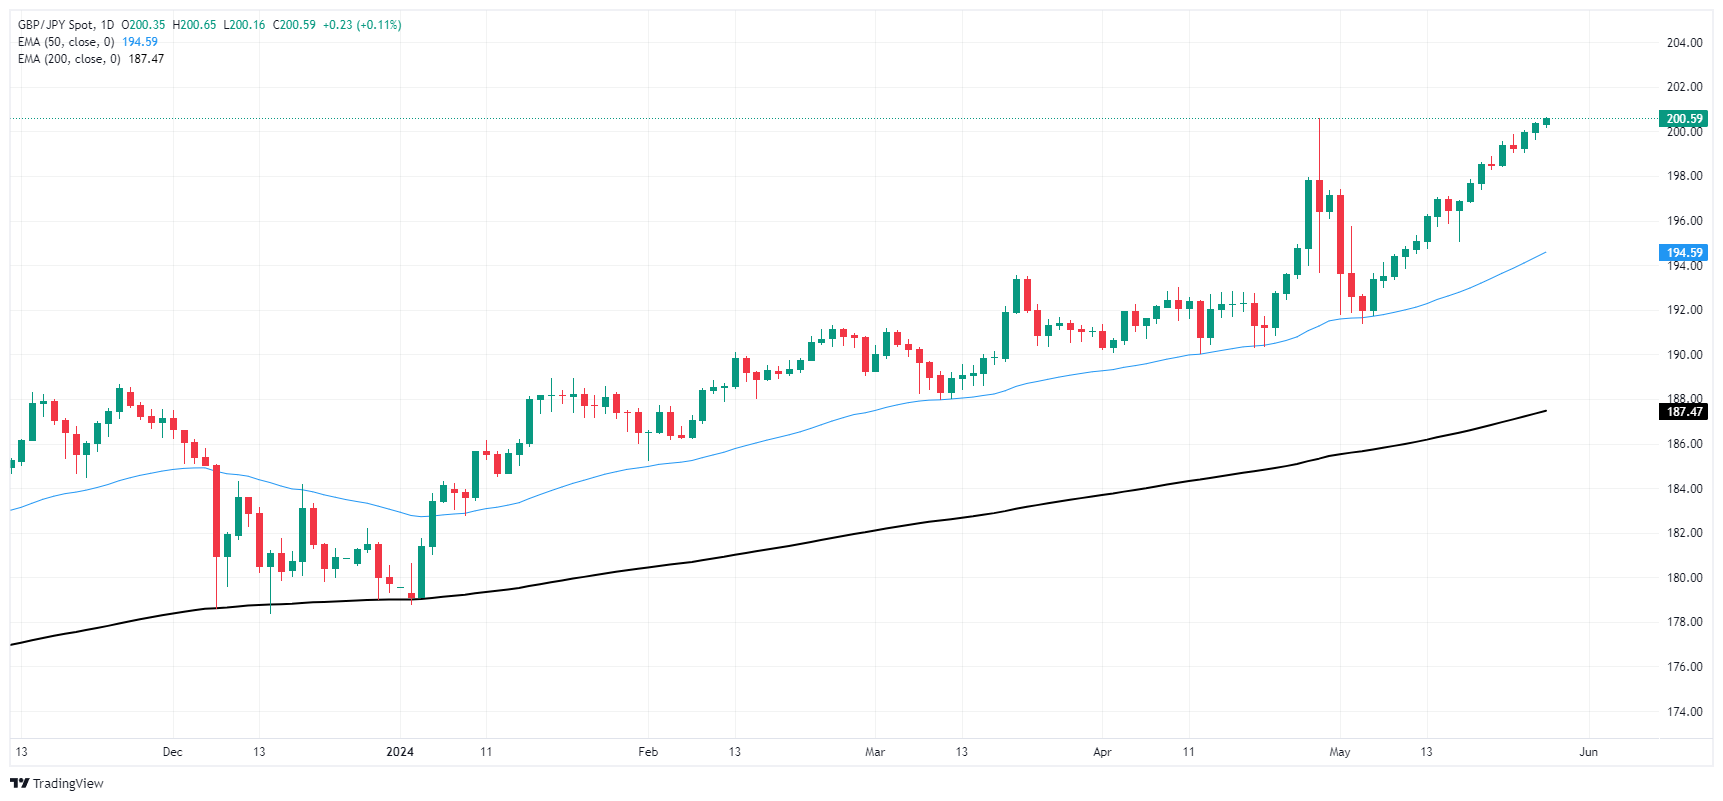


© 2000-2026. All rights reserved.
This site is managed by Teletrade D.J. LLC 2351 LLC 2022 (Euro House, Richmond Hill Road, Kingstown, VC0100, St. Vincent and the Grenadines).
The information on this website is for informational purposes only and does not constitute any investment advice.
The company does not serve or provide services to customers who are residents of the US, Canada, Iran, The Democratic People's Republic of Korea, Yemen and FATF blacklisted countries.
Making transactions on financial markets with marginal financial instruments opens up wide possibilities and allows investors who are willing to take risks to earn high profits, carrying a potentially high risk of losses at the same time. Therefore you should responsibly approach the issue of choosing the appropriate investment strategy, taking the available resources into account, before starting trading.
Use of the information: full or partial use of materials from this website must always be referenced to TeleTrade as the source of information. Use of the materials on the Internet must be accompanied by a hyperlink to teletrade.org. Automatic import of materials and information from this website is prohibited.
Please contact our PR department if you have any questions or need assistance at pr@teletrade.global.
transfers