- Analytics
- News and Tools
- Market News
- AUD/NZD clears daily losses and eye ANZ data
AUD/NZD clears daily losses and eye ANZ data
- AUD/NZD cleared daily losses, reaching 1.0852 during Tuesday's session despite soft Australian data.
- Following weak Australian data, the markets anticipate dovish moves from the RBA which may weigh on the Aussie.
- Investors await New Zealand's May ANZ business survey, which could impact the expectations on the next RBNZ policies.
The AUD/NZD is currently trading with slight gains, as market participants digest recent figures from Australia and look forward to ANZ data from New Zealand.
In Australia, Retail sales for April came in slightly under expectations at 0.1% MoM, following a 0.4% decline in March. This lackluster performance could influence the Reserve Bank of Australia's (RBA) policies and might prompt it to take a more dovish approach, taking off the table a rate hike after its New Zealander peer, the Reserve Bank of New Zealand (RBNZ) revived that discussion recently.
On the Kiwis, the anticipation in New Zealand is centered on the ANZ business survey data for May to be released during the upcoming Asian session. Depending on the results, this could sway the betting on the RBNZ's upcoming monetary policy decisions. While officials have hinted at a potential rate cut, market predictions continue to bet on a first cut to occur in Q4.
AUD/NZD technical analysis
On the daily chart, the Relative Strength Index (RSI) maintains its position in negative territory. This is fortified by the red bars of the Moving Average Convergence Divergence (MACD) histogram, confirming a continued downward momentum.
AUD/NZD daily chart
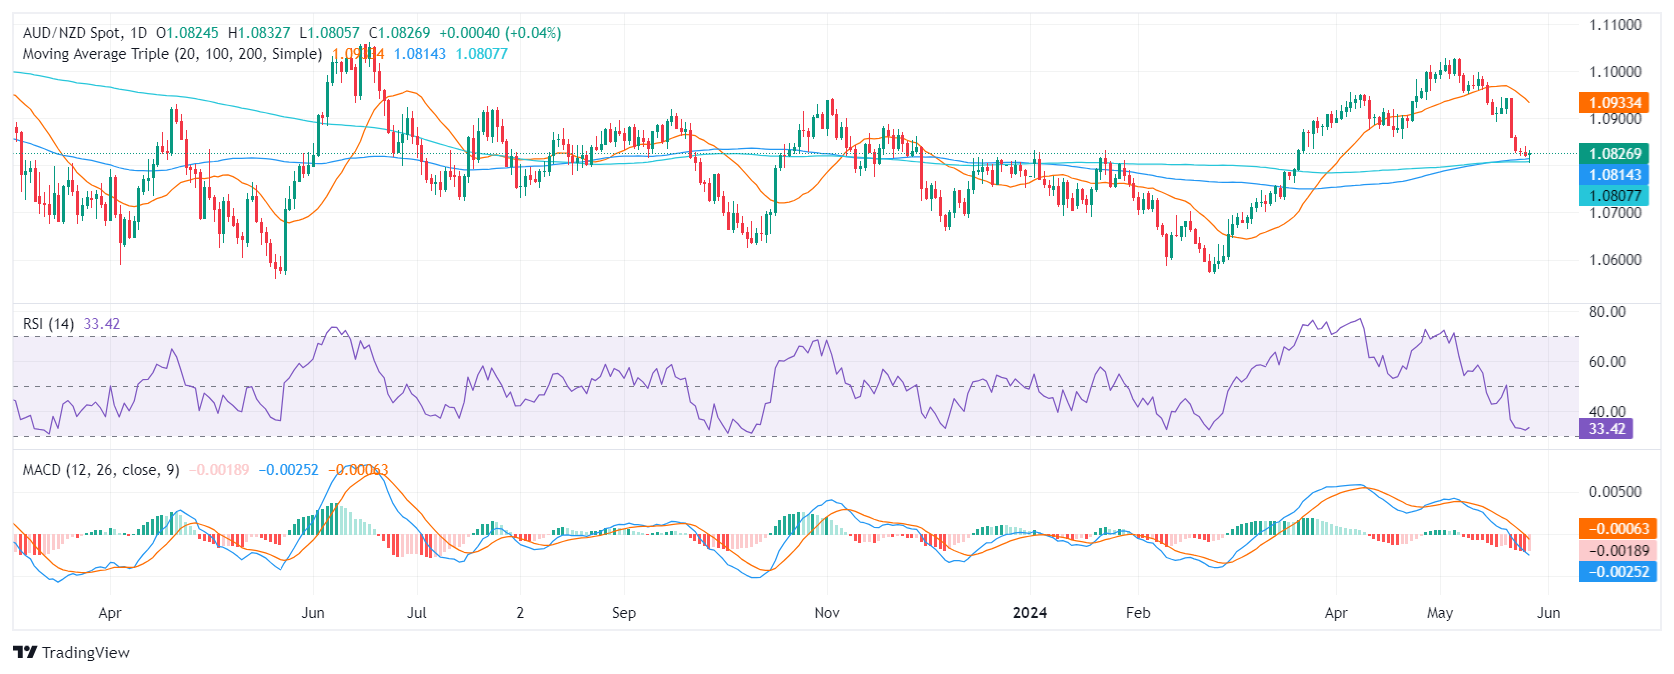
Nevertheless, the pair trades above its 100- and 200-day Simple Moving Averages (SMA), suggesting a medium-to-long uptrend. However, with the AUD/NZD standing below the 20-day SMA, it highlights a dominance for the short-term.


© 2000-2026. All rights reserved.
This site is managed by Teletrade D.J. LLC 2351 LLC 2022 (Euro House, Richmond Hill Road, Kingstown, VC0100, St. Vincent and the Grenadines).
The information on this website is for informational purposes only and does not constitute any investment advice.
The company does not serve or provide services to customers who are residents of the US, Canada, Iran, The Democratic People's Republic of Korea, Yemen and FATF blacklisted countries.
Making transactions on financial markets with marginal financial instruments opens up wide possibilities and allows investors who are willing to take risks to earn high profits, carrying a potentially high risk of losses at the same time. Therefore you should responsibly approach the issue of choosing the appropriate investment strategy, taking the available resources into account, before starting trading.
Use of the information: full or partial use of materials from this website must always be referenced to TeleTrade as the source of information. Use of the materials on the Internet must be accompanied by a hyperlink to teletrade.org. Automatic import of materials and information from this website is prohibited.
Please contact our PR department if you have any questions or need assistance at pr@teletrade.global.
transfers