- Analytics
- News and Tools
- Market News
- NZD/JPY Price Analysis: Bullish momentum sustains, potential correction looms on overbought conditions
NZD/JPY Price Analysis: Bullish momentum sustains, potential correction looms on overbought conditions
- The daily chart flashes overbought signals but the overall trend favors the bulls.
- Post achieving multi-year highs over 96.70, NZD/JPY shows a possibility for a healthy technical correction.
- The pair has a strong support level at 95.00, a crucial point for buyers to defend to contain potential losses.
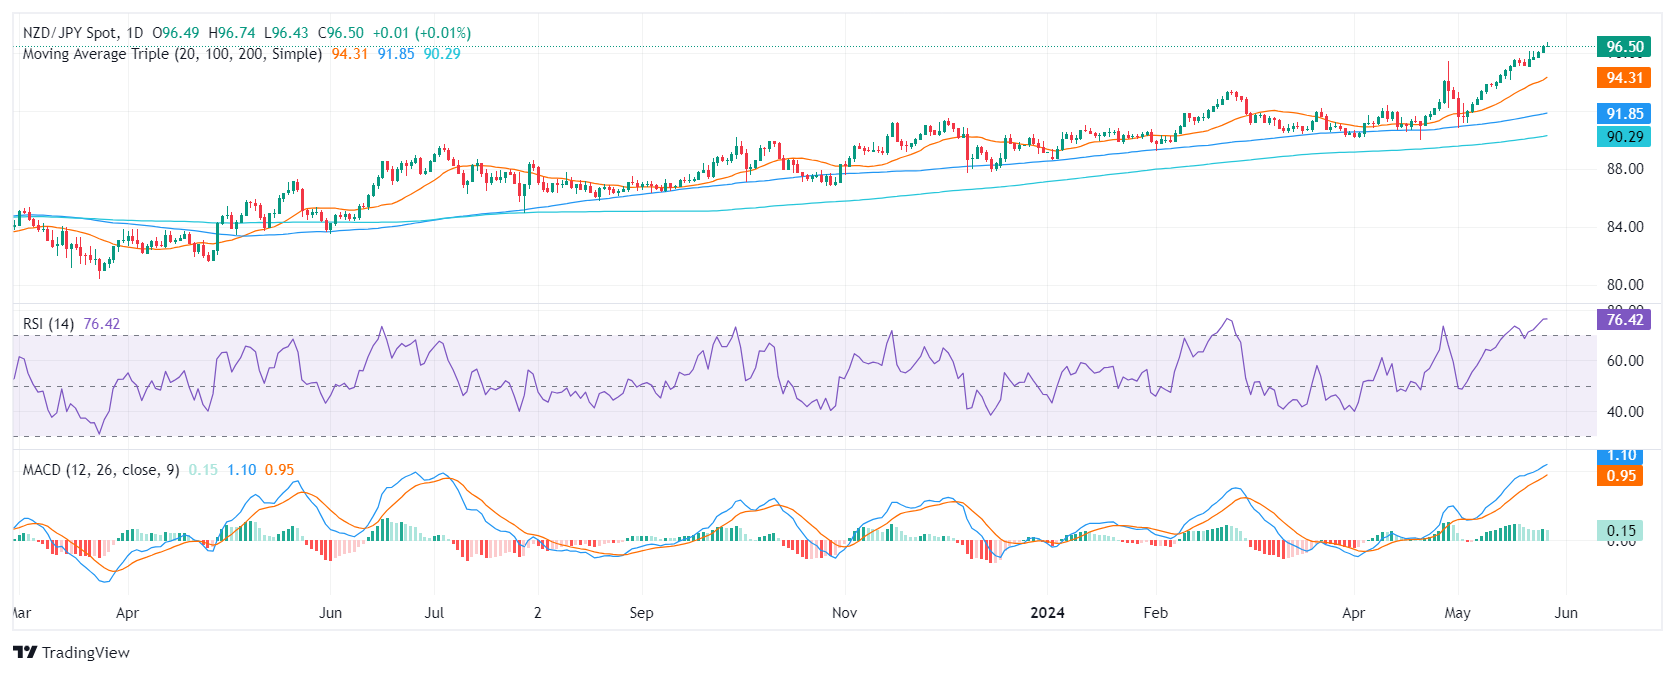
On Tuesday's session, the NZD/JPY pair rose to 96.62 it highest level since July 2007. The outlook has shifted to cautious, with signs of a possible reversal in momentum as indicators flash overbought signals, but the overall bullish outlook remains intact.
Based on the daily chart indicators, the Relative Strength Index (RSI) consistently reflects overbought conditions standing deep in the overbought threshold. This hints at a potential downward price correction. Concurrently, the Moving Average Convergence Divergence (MACD) evidences continued positive momentum with its flat green bars.
NZD/JPY daily chart
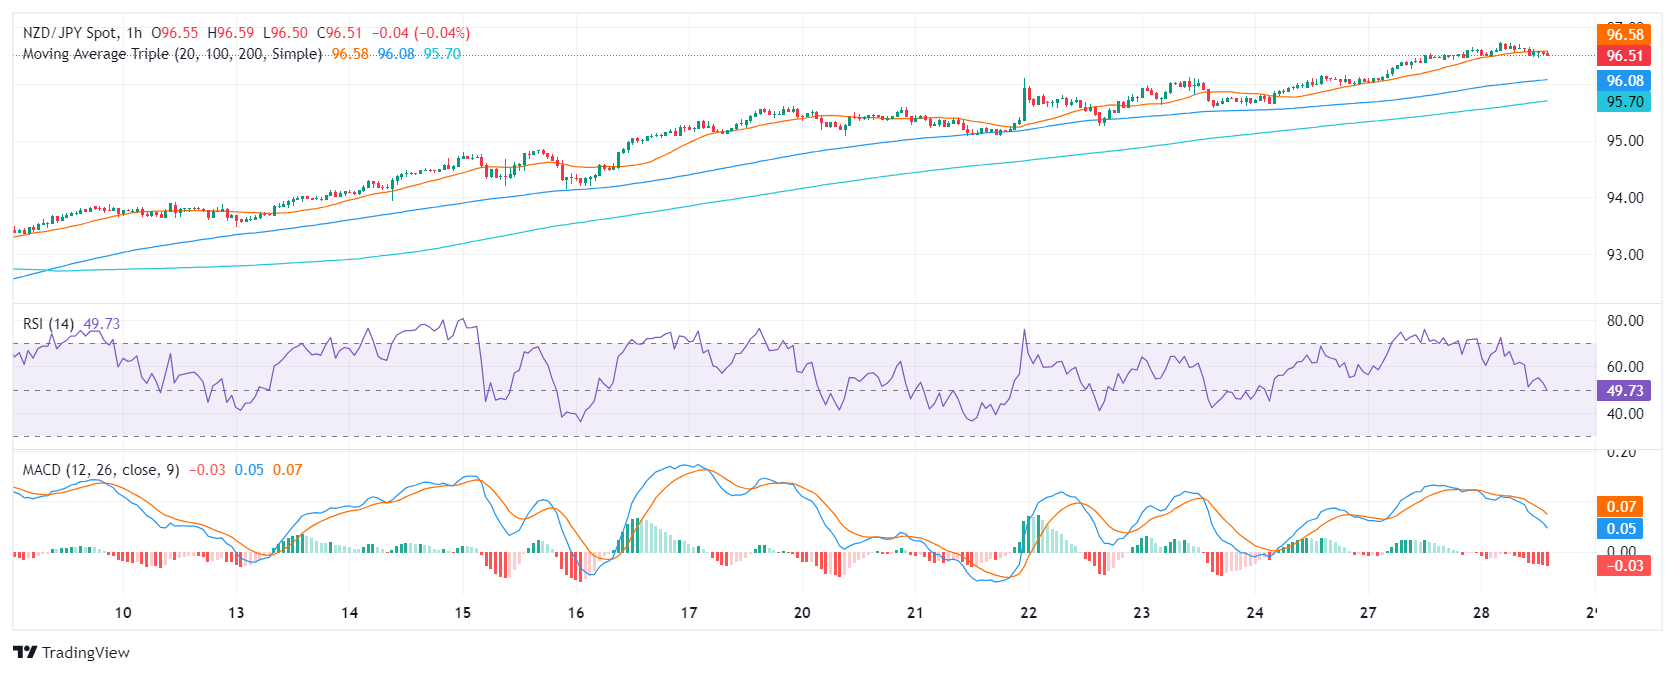
Looking at the hourly chart, the RSI demonstrates lower strength compared to the daily view and has already started to edge downwards. In line with that, the MACD histogram suggests negative momentum as revealed by the presence of red bars.
NZD/JPY hourly chart
In the broader context, the NZD/JPY presently exhibits a strong uptrend, as displayed by its position above the 20, 100, and 200-day Simple Moving Averages (SMA). This indicates that the currency pair's short-term gains are exceeding both its medium and long-term averages.
As a correction looms, any downward movements that keep the pair above its SMAs could be considered corrective, with the first strong support seen at around 95.00.


© 2000-2026. All rights reserved.
This site is managed by Teletrade D.J. LLC 2351 LLC 2022 (Euro House, Richmond Hill Road, Kingstown, VC0100, St. Vincent and the Grenadines).
The information on this website is for informational purposes only and does not constitute any investment advice.
The company does not serve or provide services to customers who are residents of the US, Canada, Iran, The Democratic People's Republic of Korea, Yemen and FATF blacklisted countries.
Making transactions on financial markets with marginal financial instruments opens up wide possibilities and allows investors who are willing to take risks to earn high profits, carrying a potentially high risk of losses at the same time. Therefore you should responsibly approach the issue of choosing the appropriate investment strategy, taking the available resources into account, before starting trading.
Use of the information: full or partial use of materials from this website must always be referenced to TeleTrade as the source of information. Use of the materials on the Internet must be accompanied by a hyperlink to teletrade.org. Automatic import of materials and information from this website is prohibited.
Please contact our PR department if you have any questions or need assistance at pr@teletrade.global.
transfers