- Analytics
- News and Tools
- Market News
- GBP/USD Price Analysis: Stays firm despite retreating at 1.2800 as bears loom
GBP/USD Price Analysis: Stays firm despite retreating at 1.2800 as bears loom
- GBP/USD maintains gains at 1.2786, up 0.14% from daily high.
- Resistance trendline and overbought RSI hint at potential correction.
- Short-term bearish engulfing pattern signals possible downward pressure.
The British Pound demonstrated its resilience against the Greenback on Tuesday, maintaining its gains as traders in the UK and the US returned after a long weekend. The GBP/USD is currently trading at 1.2786, showing a steady increase of 0.14% from its daily high of 1.2800.
GBP/USD Price Analysis: Technical outlook
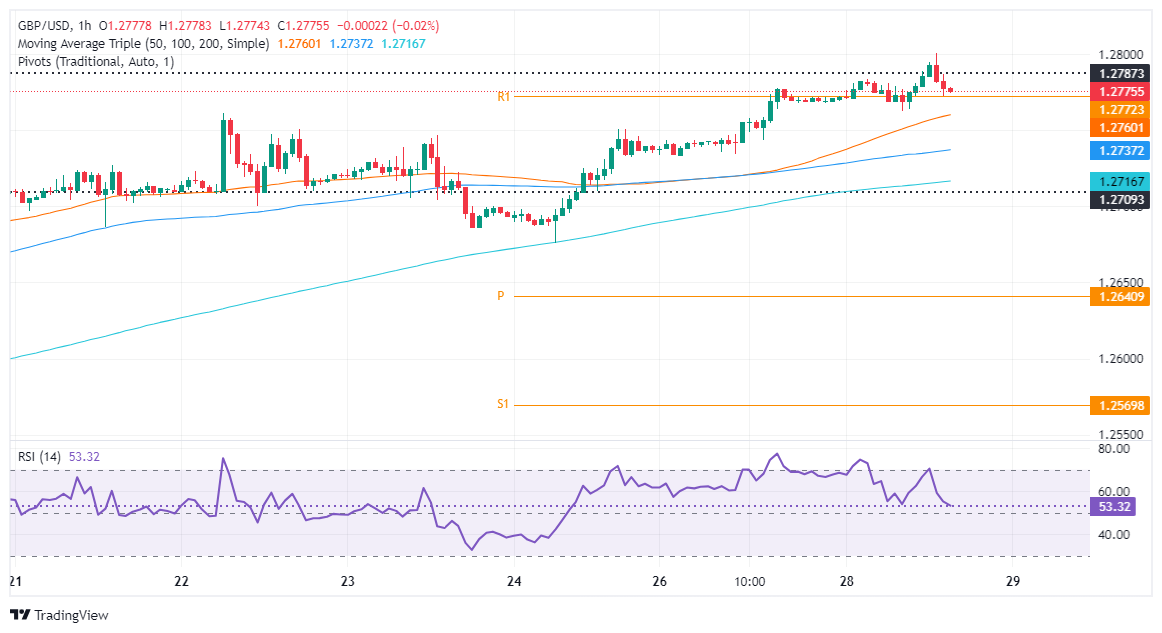
The GBP/USD tested the 1.2800 figure, yet a confluence of technical indicators with a downslope resistance trendline drawn from the highs of July 2023 and the March 21 cycle high at around 1.2803, pushed the exchange rate back to current spot prices. Momentum is in favor of buyers, but the Relative Strength Index (RSI) is about to turn overbought, hinting the pair could be headed for a correction.
In the short term, the GBP/USD hourly chart has formed a ‘bearish engulfing’ candle chart pattern, an indication that a leg-down is underway. Additionally, bullish momentum is fading as the Relative Strength Index (RSI) aims toward the 50 midline, which, once crossed, could exert downward pressure on the major.
Key support levels lie at the current day’s low of1.2762, followed by the confluence of the 50-simple moving average (SMA) at 1.2759, followed by the confluence of the100-SMA and the S1 pivot point at around 1.2736/39, ahead of the 200-SMA at 1.2716.
Conversely, if buyers stepped in and pushed prices above 1.2803, look for a re-test of the year-to-date (YTD) high of 1.2893.
GBP/USD Price Action – Hourly Chart


© 2000-2026. All rights reserved.
This site is managed by Teletrade D.J. LLC 2351 LLC 2022 (Euro House, Richmond Hill Road, Kingstown, VC0100, St. Vincent and the Grenadines).
The information on this website is for informational purposes only and does not constitute any investment advice.
The company does not serve or provide services to customers who are residents of the US, Canada, Iran, The Democratic People's Republic of Korea, Yemen and FATF blacklisted countries.
Making transactions on financial markets with marginal financial instruments opens up wide possibilities and allows investors who are willing to take risks to earn high profits, carrying a potentially high risk of losses at the same time. Therefore you should responsibly approach the issue of choosing the appropriate investment strategy, taking the available resources into account, before starting trading.
Use of the information: full or partial use of materials from this website must always be referenced to TeleTrade as the source of information. Use of the materials on the Internet must be accompanied by a hyperlink to teletrade.org. Automatic import of materials and information from this website is prohibited.
Please contact our PR department if you have any questions or need assistance at pr@teletrade.global.
transfers