- Analytics
- News and Tools
- Market News
- AUD/NZD experiences a slight decline as markets await key data
AUD/NZD experiences a slight decline as markets await key data
- AUD/NZD dips mildly to 1.0821 during Monday's session.
- Markets are eyeing Australia's April CPI and Retail Sales updates this week.
- Investors will eye New Zealand's May ANZ business survey, which is expected to reveal a slowdown in activity.
The AUD/NZD is presently trading with mild fluctuations, expecting key figures from Australia and New Zealand along the week.
On the Australian side, the focus is primarily on the April Consumer Price Index (CPI) and Retail sales data. The CPI is projected to register a slight decrease, dropping to 3.4% YoY while Retail Sales are expected to recover somewhat. The outcome of the data might shape the expectations of the Reserve Bank of Australia (RBA) which has lately advocated for a cautious stance.
On the other hand, the attention in New Zealand is directed towards the ANZ business survey data for May on Tuesday. The outcome might also shape the bets on the next Reserve Bank of New Zealand (RBNZ)'s monetary policy decisions. While the bank suggested a potential rate hike, market prediction indicates an opposing view, leaning towards a first rate cut in November.
AUD/NZD technical analysis
In the daily chart, the Relative Strength Index (RSI) sits within negative territory. Despite an uptick in the latest reading to 30, the pair remains pressured, as the positive momentum observed earlier in the week has considerably waned. The negative trend, as suggested by the RSI, is further confirmed by the rising red bars of the Moving Average Convergence Divergence (MACD) histogram, affirming the downside momentum.
AUD/NZD daily chart
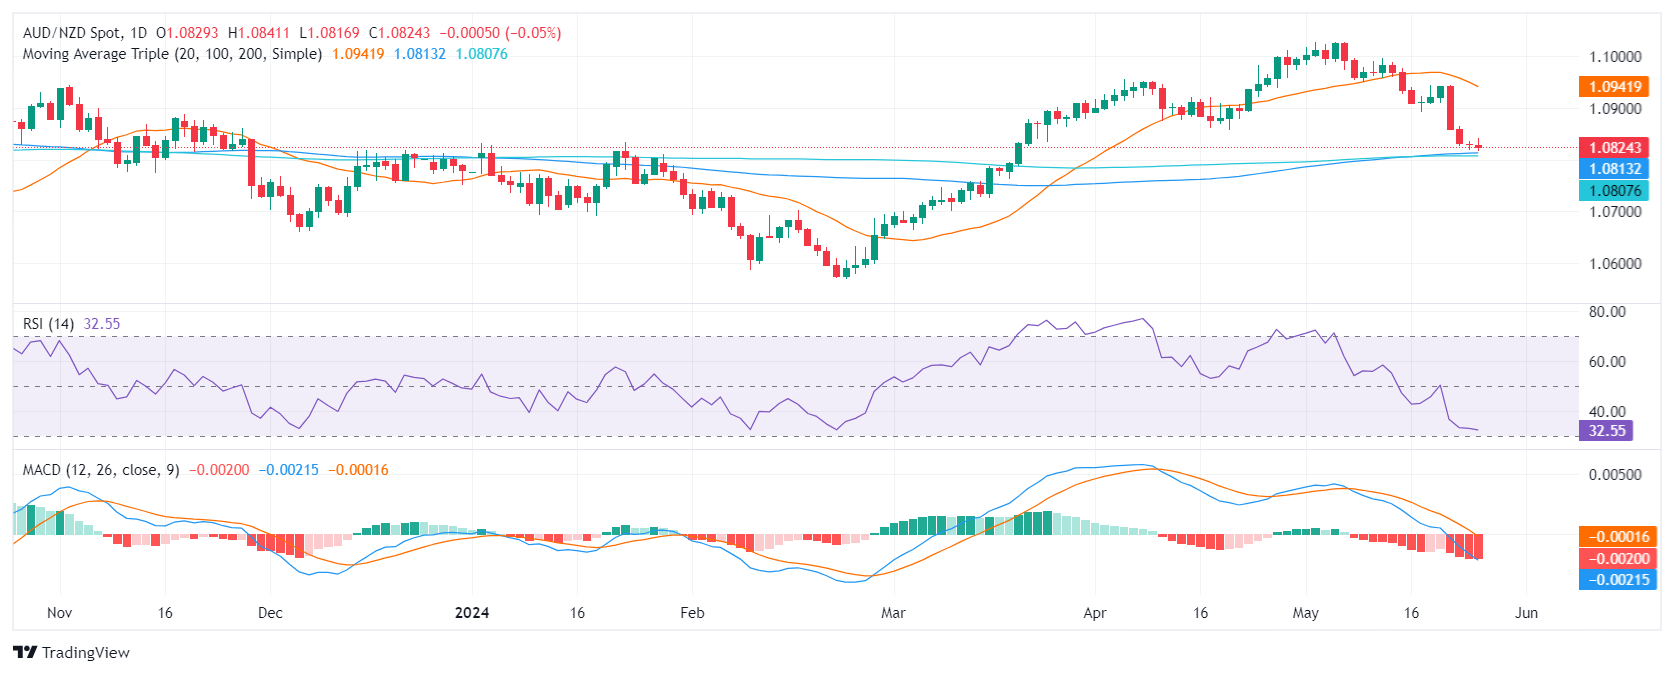
On a positive note, the pair currently trades above its 100 and 200-day Simple Moving Averages (SMA), indicating potential medium-to-long-term upward momentum. However, the AUD/NZD's positioning below the 20-day SMA highlights the near-term volatility anticipated.


© 2000-2026. All rights reserved.
This site is managed by Teletrade D.J. LLC 2351 LLC 2022 (Euro House, Richmond Hill Road, Kingstown, VC0100, St. Vincent and the Grenadines).
The information on this website is for informational purposes only and does not constitute any investment advice.
The company does not serve or provide services to customers who are residents of the US, Canada, Iran, The Democratic People's Republic of Korea, Yemen and FATF blacklisted countries.
Making transactions on financial markets with marginal financial instruments opens up wide possibilities and allows investors who are willing to take risks to earn high profits, carrying a potentially high risk of losses at the same time. Therefore you should responsibly approach the issue of choosing the appropriate investment strategy, taking the available resources into account, before starting trading.
Use of the information: full or partial use of materials from this website must always be referenced to TeleTrade as the source of information. Use of the materials on the Internet must be accompanied by a hyperlink to teletrade.org. Automatic import of materials and information from this website is prohibited.
Please contact our PR department if you have any questions or need assistance at pr@teletrade.global.
transfers