- Analytics
- News and Tools
- Market News
- EUR/JPY Price Analysis: Bulls times might be up as indicators approach overbought territory
EUR/JPY Price Analysis: Bulls times might be up as indicators approach overbought territory
- The daily RSI and MACD remain in positive territory but suggest that consolidation may be incoming..
- The same indicators on the hourly chart hint also signal a possible consolidation phase subsequent to recent gains.
- The EUR/JPY's position above primary SMAs maintains long-term bullish sentiment.
In Monday's session, the EUR/JPY pair is trading mildly higher, showing continued dominance by the bulls. However, caution must be exercised due to signs of overbought conditions, which tend to be followed by downward movements
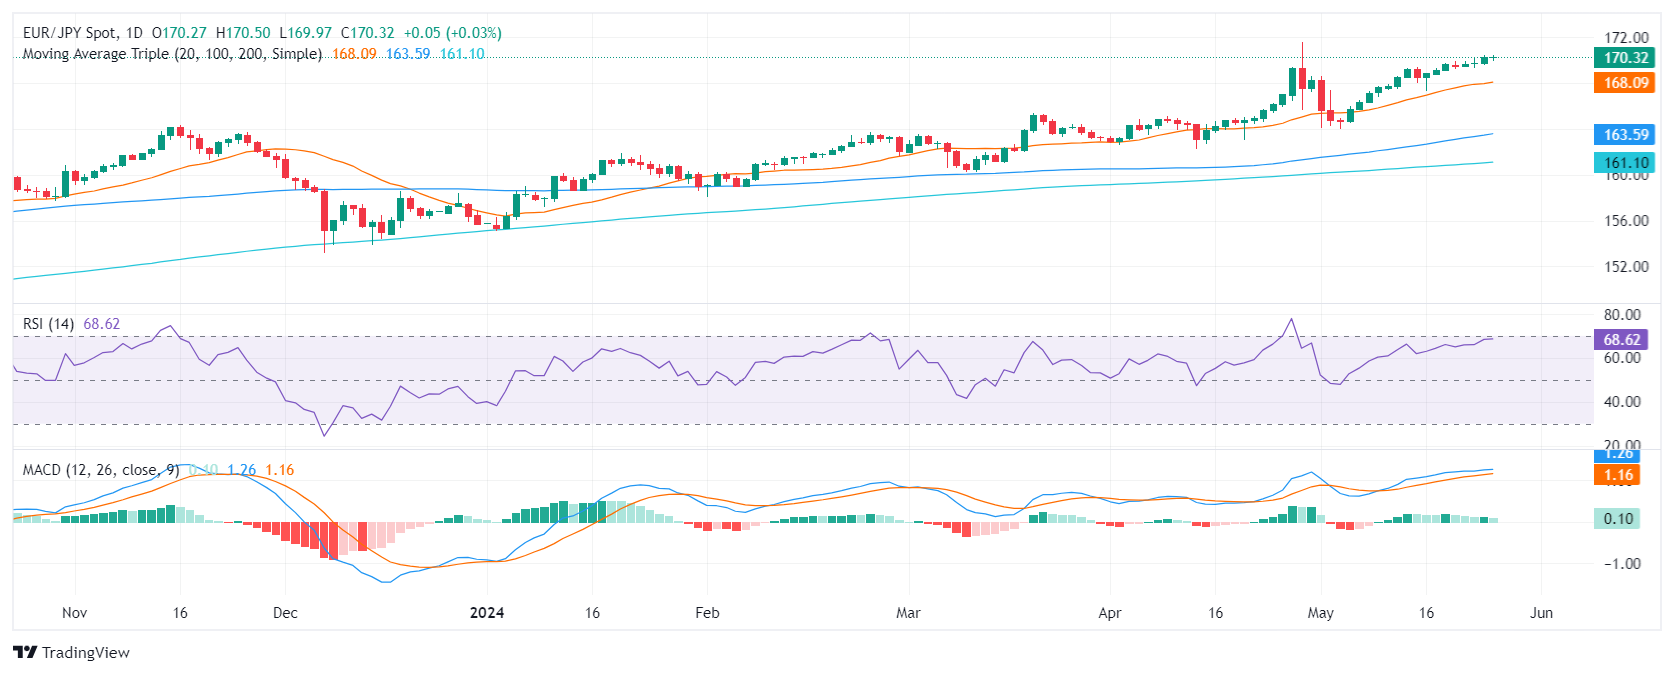
In the daily analysis, the Relative Strength Index (RSI) for the EUR/JPY pair has been observing a steady positive trend. It points out that buyers hold a strong position with the latest reading nearing overbought territory. Concurrently, the Moving Average Convergence Divergence (MACD) histogram fortifies this stance, demonstrating flat green bars symbolizing a steady but flattening positive momentum.
EUR/JPY daily chart
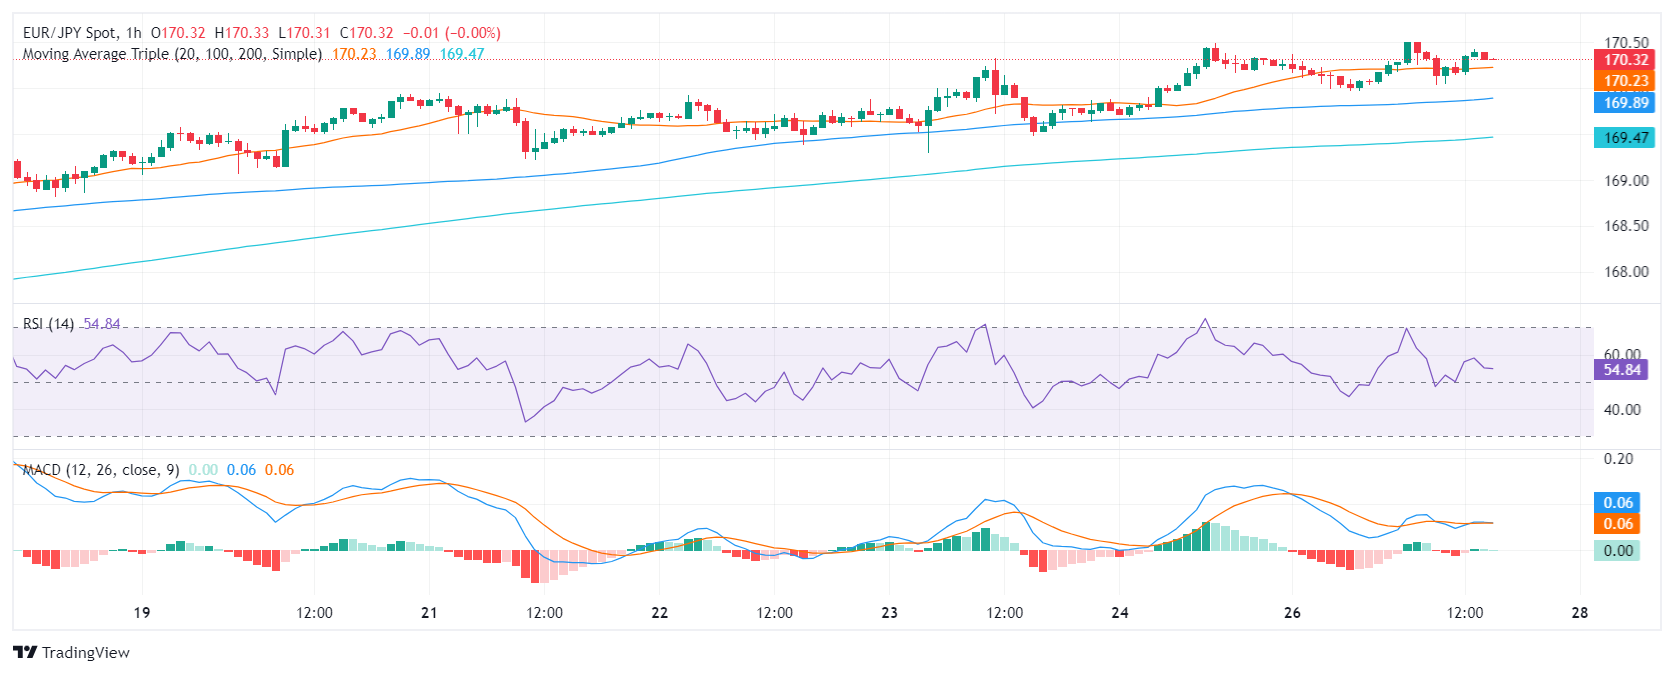
Transitioning to the hourly chart, the RSI has dipped from high-positive towards a negative slope, with the latest reading at 54, distancing itself from an earlier overbought condition. The MACD histogram also hints at a pace alteration, continuing to print flat green bars, implying a downturn in buying pressure.
EUR/JPY hourly chart
The EUR/JPY robust performance is highlighted by its position above the key Simple Moving Average (SMA) benchmarks at 20,100, and 200 days. However, a technical correction may be incoming but any movements which keep the pair above these levels could be considered as mere consolidation.


© 2000-2026. All rights reserved.
This site is managed by Teletrade D.J. LLC 2351 LLC 2022 (Euro House, Richmond Hill Road, Kingstown, VC0100, St. Vincent and the Grenadines).
The information on this website is for informational purposes only and does not constitute any investment advice.
The company does not serve or provide services to customers who are residents of the US, Canada, Iran, The Democratic People's Republic of Korea, Yemen and FATF blacklisted countries.
Making transactions on financial markets with marginal financial instruments opens up wide possibilities and allows investors who are willing to take risks to earn high profits, carrying a potentially high risk of losses at the same time. Therefore you should responsibly approach the issue of choosing the appropriate investment strategy, taking the available resources into account, before starting trading.
Use of the information: full or partial use of materials from this website must always be referenced to TeleTrade as the source of information. Use of the materials on the Internet must be accompanied by a hyperlink to teletrade.org. Automatic import of materials and information from this website is prohibited.
Please contact our PR department if you have any questions or need assistance at pr@teletrade.global.
transfers