- Analytics
- News and Tools
- Market News
- NZD/USD Price Analysis: Bullish sentiment maintains despite softening momentum
NZD/USD Price Analysis: Bullish sentiment maintains despite softening momentum
- Despite softening positive momentum indicated by the daily MACD, the overall trend still favors the buyers.
- Hourly chart shows fairly neutral RSI but negative momentum in MACD, signaling possible short-term fluctuations.
- Regardless of potential shifts suggested by hourly indicators, the overall bullish bias based on daily SMAs is intact.
- Signs of weakening buying momentum in NZD/USD implies potential retests of key SMAs, dictating investor alertness.
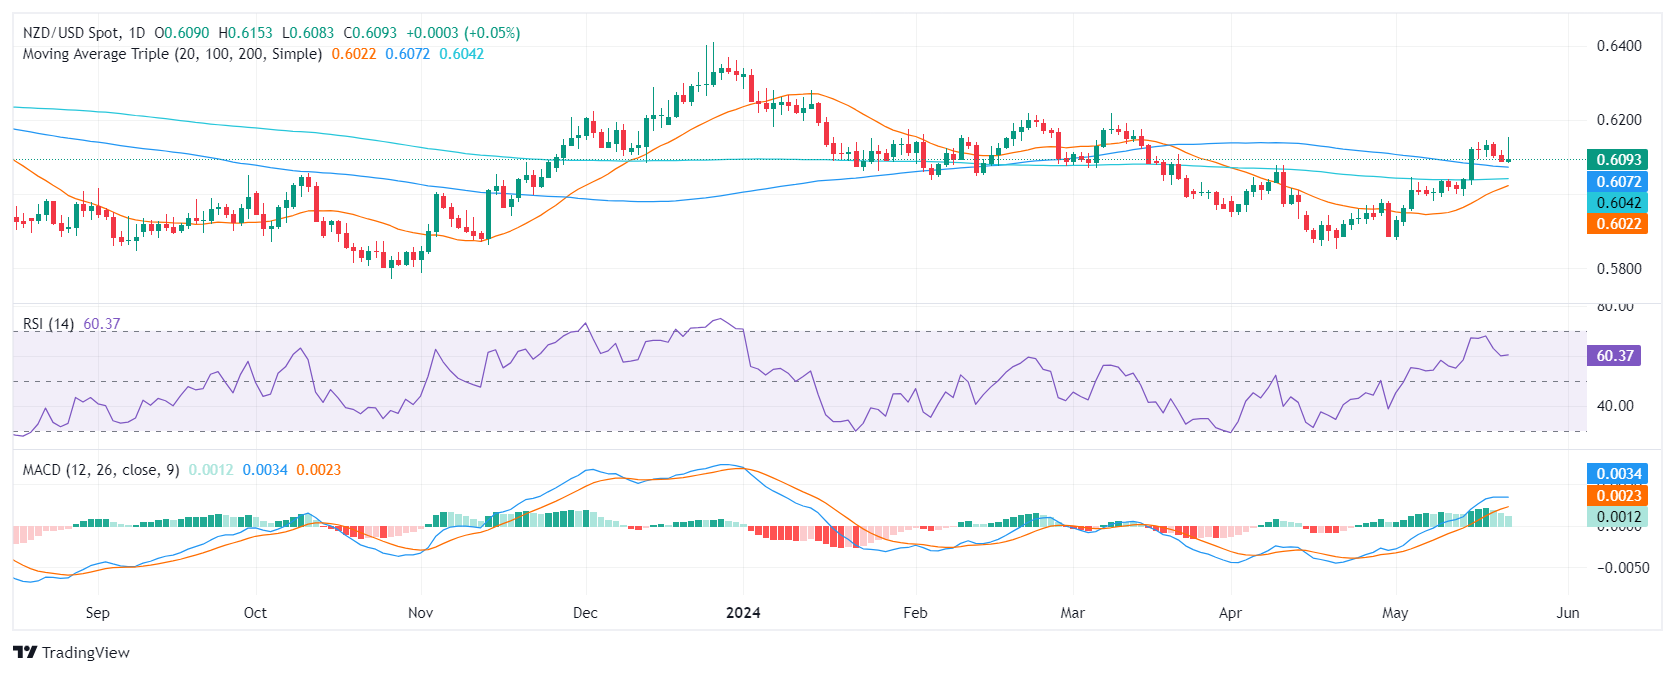
On Wednesday's session, the NZD/USD showed diminishing buying traction and fell just below 0.6100. However, the short-term outlook will be positive if the pair maintains its position over new reference points set by 100 and 200-day Simple Moving Averages (SMAs). If lost, the bears might step in aggressively.
Examining the daily chart, the Relative Strength Index (RSI) exhibits a positive but flattening trend, with its most recent reading of 60. Simultaneously, the Moving Average Convergence Divergence (MACD) displays decreasing green bars indicating a slight softening of positive momentum.
NZD/USD daily chart
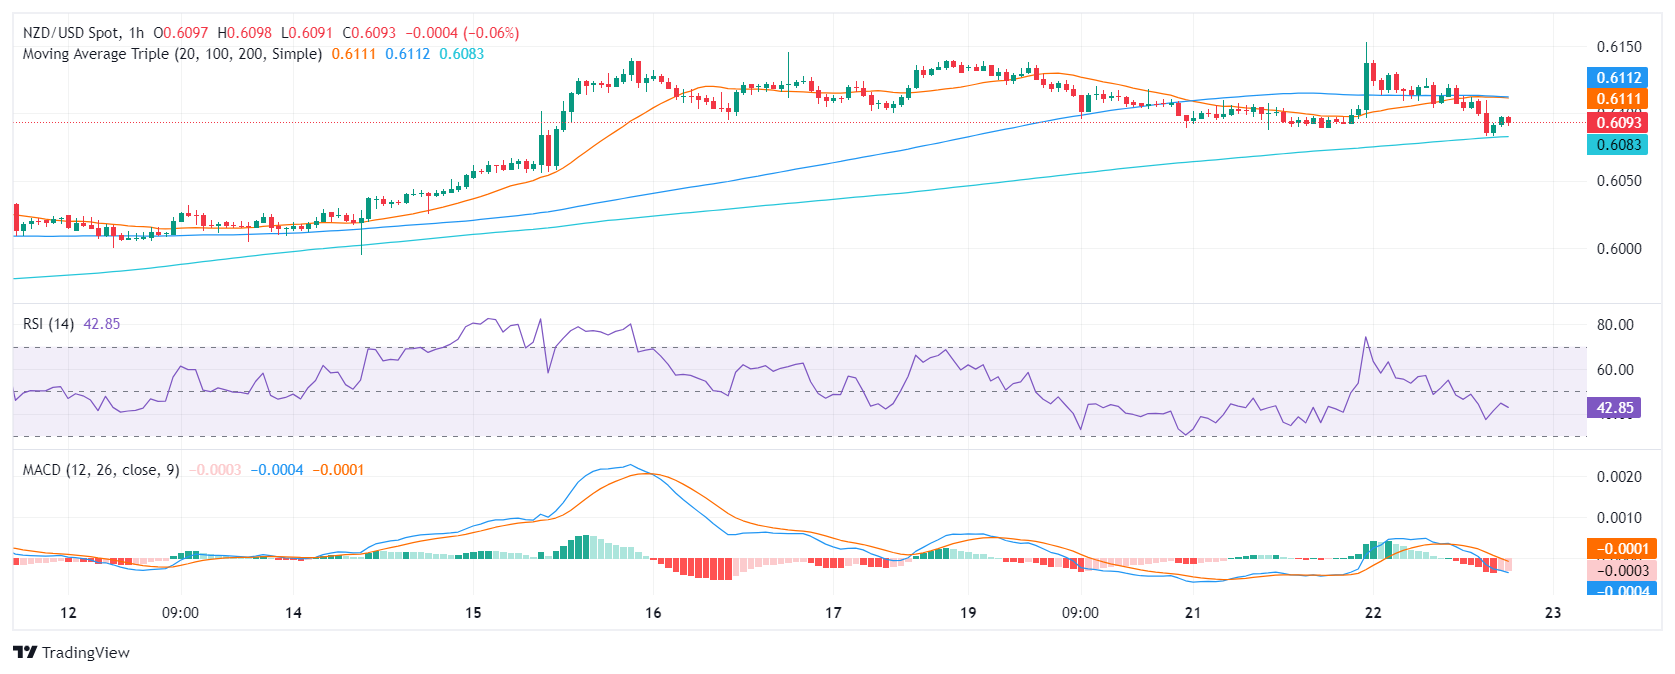
Focusing on the hourly view, the RSI has moderately adjusted with the latest reading of 41, reflecting a fairly neutral direction. Notably, the MACD histogram has produced consistently flat red bars, signaling negative momentum on an intraday basis.
NZD/USD hourly chart
In conclusion, investors seem to be taking profits and, should the pair hold above the recently-conquered 100 and 200-day Simple Moving Averages (SMAs), any downward movement should not necessarily be considered a selling signal. However, buying traction appears to be waning, and the pair is set for a retest of the mentioned SMAs.


© 2000-2026. All rights reserved.
This site is managed by Teletrade D.J. LLC 2351 LLC 2022 (Euro House, Richmond Hill Road, Kingstown, VC0100, St. Vincent and the Grenadines).
The information on this website is for informational purposes only and does not constitute any investment advice.
The company does not serve or provide services to customers who are residents of the US, Canada, Iran, The Democratic People's Republic of Korea, Yemen and FATF blacklisted countries.
Making transactions on financial markets with marginal financial instruments opens up wide possibilities and allows investors who are willing to take risks to earn high profits, carrying a potentially high risk of losses at the same time. Therefore you should responsibly approach the issue of choosing the appropriate investment strategy, taking the available resources into account, before starting trading.
Use of the information: full or partial use of materials from this website must always be referenced to TeleTrade as the source of information. Use of the materials on the Internet must be accompanied by a hyperlink to teletrade.org. Automatic import of materials and information from this website is prohibited.
Please contact our PR department if you have any questions or need assistance at pr@teletrade.global.
transfers