- Analytics
- News and Tools
- Market News
- USD/THB finds momentum as bears fail to breach the 100-day SMA
USD/THB finds momentum as bears fail to breach the 100-day SMA
- The USD/THB pair advanced nicely in Tuesday's session, standing at 36.36 with a rally of 0.80%.
- The USD is holding its ground due to the measured remarks from Fed officials.
- Wednesday's FOMC minutes, May's S&P PMIs, and April's Durable Goods Orders from the US are next in line in the economic calendar.
The USD/THB gathered significant traction on Tuesday and rallied by 0.80% as bears exhausted after failing to conquer the 100-day Simple Moving Average (SMA) at 36.05. Despite April's US Consumer Price Index (CPI) data reflecting stronger-than-expected inflation numbers, the USD is holding its ground as the Federal Reserve (Fed) continues to ask for patience for the rate cuts.
Given the cautious stance from the Fed officials and the wait-and-see approach perceived by the markets, any immediate movement other than technical swings for the USD/THB pair seems unlikely as it remains at a steady pace. Further insights regarding the health of the US economy could be gained from releasing US's May's S&P PMIs on Thursday and April's Durable Goods Orders on Friday which could trigger movements on the pair.
The Federal Open Market Committee (FOMC) minutes from the May meeting, will be released on Wednesday and may also trigger volatility. As for now, markets continue to discount higher odds of the easing starting in September.
USD/THB technical analysis
Examining the daily chart, the Relative Strength Index (RSI) reveals a minor strengthening trend for the USD/THB pair, moving away from the oversold conditions noted on Monday. The RSI has gained ground but is yet to escape the negative trend zone.
The Moving Average Convergence Divergence (MACD) histogram, appended to this analysis, sketches a decreasing negative momentum, signaled by the decrease in red bars. Sellers currently dominate the market. Yet, the decrease in negative momentum could hint at a potential shift in balance.
USD/THB daily chart
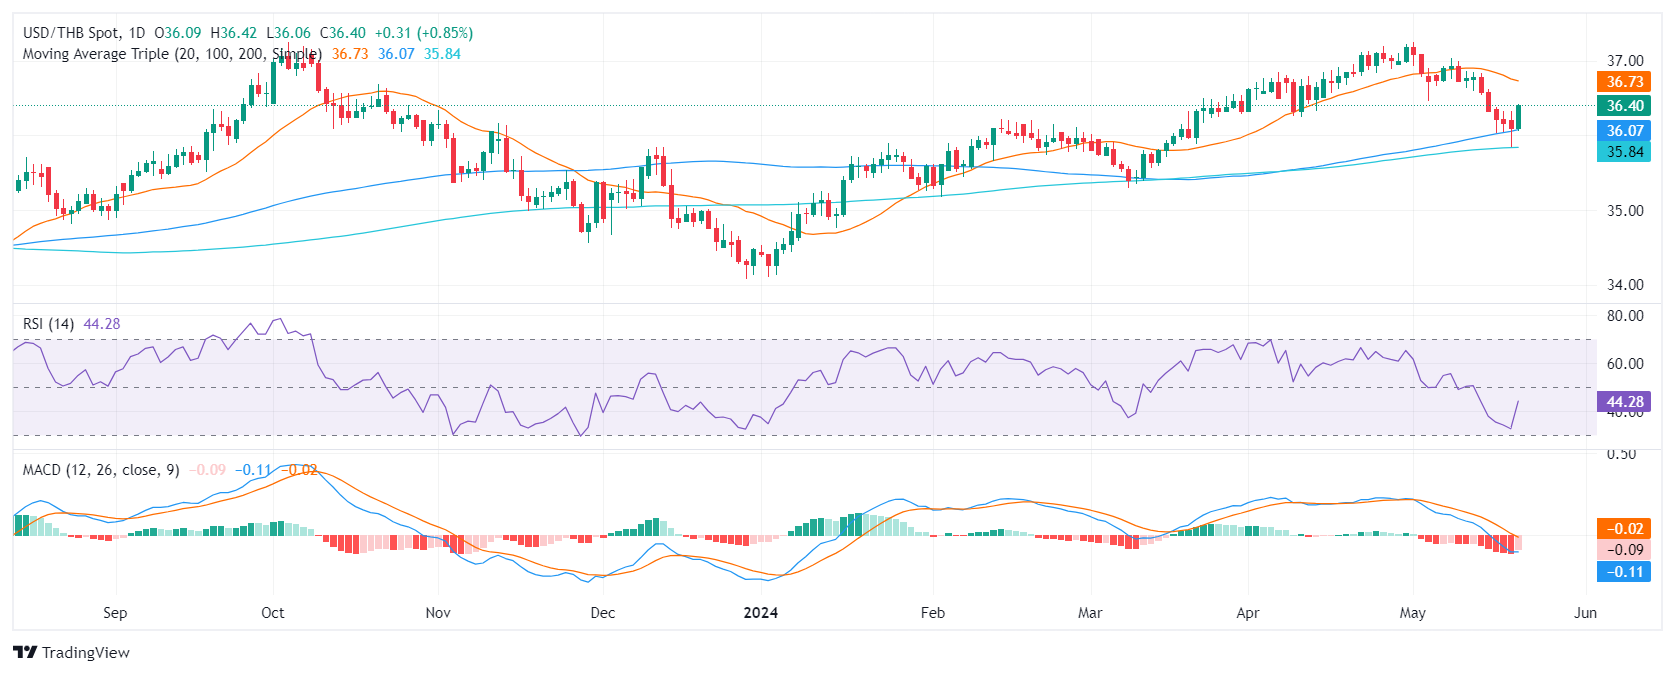
The broader outlook reveals critical insights into the USD/THB's position relative to its Simple Moving Averages (SMAs). The pair's steadfast defense of the 10, and 200-day SMAs reveals that the overall trend remains bullish. However, the loss of the 20-day SMA suggests a slightly negative short-term trend.


© 2000-2026. All rights reserved.
This site is managed by Teletrade D.J. LLC 2351 LLC 2022 (Euro House, Richmond Hill Road, Kingstown, VC0100, St. Vincent and the Grenadines).
The information on this website is for informational purposes only and does not constitute any investment advice.
The company does not serve or provide services to customers who are residents of the US, Canada, Iran, The Democratic People's Republic of Korea, Yemen and FATF blacklisted countries.
Making transactions on financial markets with marginal financial instruments opens up wide possibilities and allows investors who are willing to take risks to earn high profits, carrying a potentially high risk of losses at the same time. Therefore you should responsibly approach the issue of choosing the appropriate investment strategy, taking the available resources into account, before starting trading.
Use of the information: full or partial use of materials from this website must always be referenced to TeleTrade as the source of information. Use of the materials on the Internet must be accompanied by a hyperlink to teletrade.org. Automatic import of materials and information from this website is prohibited.
Please contact our PR department if you have any questions or need assistance at pr@teletrade.global.
transfers