- Analytics
- News and Tools
- Market News
- EUR/JPY Price Analysis: Extends its upside, the next hurdle is seen at 169.40
EUR/JPY Price Analysis: Extends its upside, the next hurdle is seen at 169.40
- EUR/JPY gains momentum near 169.20 in Friday’s early European session.
- The cross keeps the bullish vibe unchanged above the key EMA, with the RSI indicator standing above the 50-midline.
- The first upside barrier is seen at 169.40; 167.80 acts as an initial support level.
The EUR/JPY cross extends the rally around 169.20 during the early European trading hours on Friday. The Japanese Yen (JPY) has weakened as Japan's economy contracted more than expected in the first quarter (Q1) of 2024, challenging the Bank of Japan's (BoJ) push to get interest rates further away from near zero. On Friday, the BoJ left the amount of bonds it buys at regular operations unchanged, adding to a modest dip in the JPY after helping the currency earlier in the week with a surprise reduction in purchases, per Bloomberg.
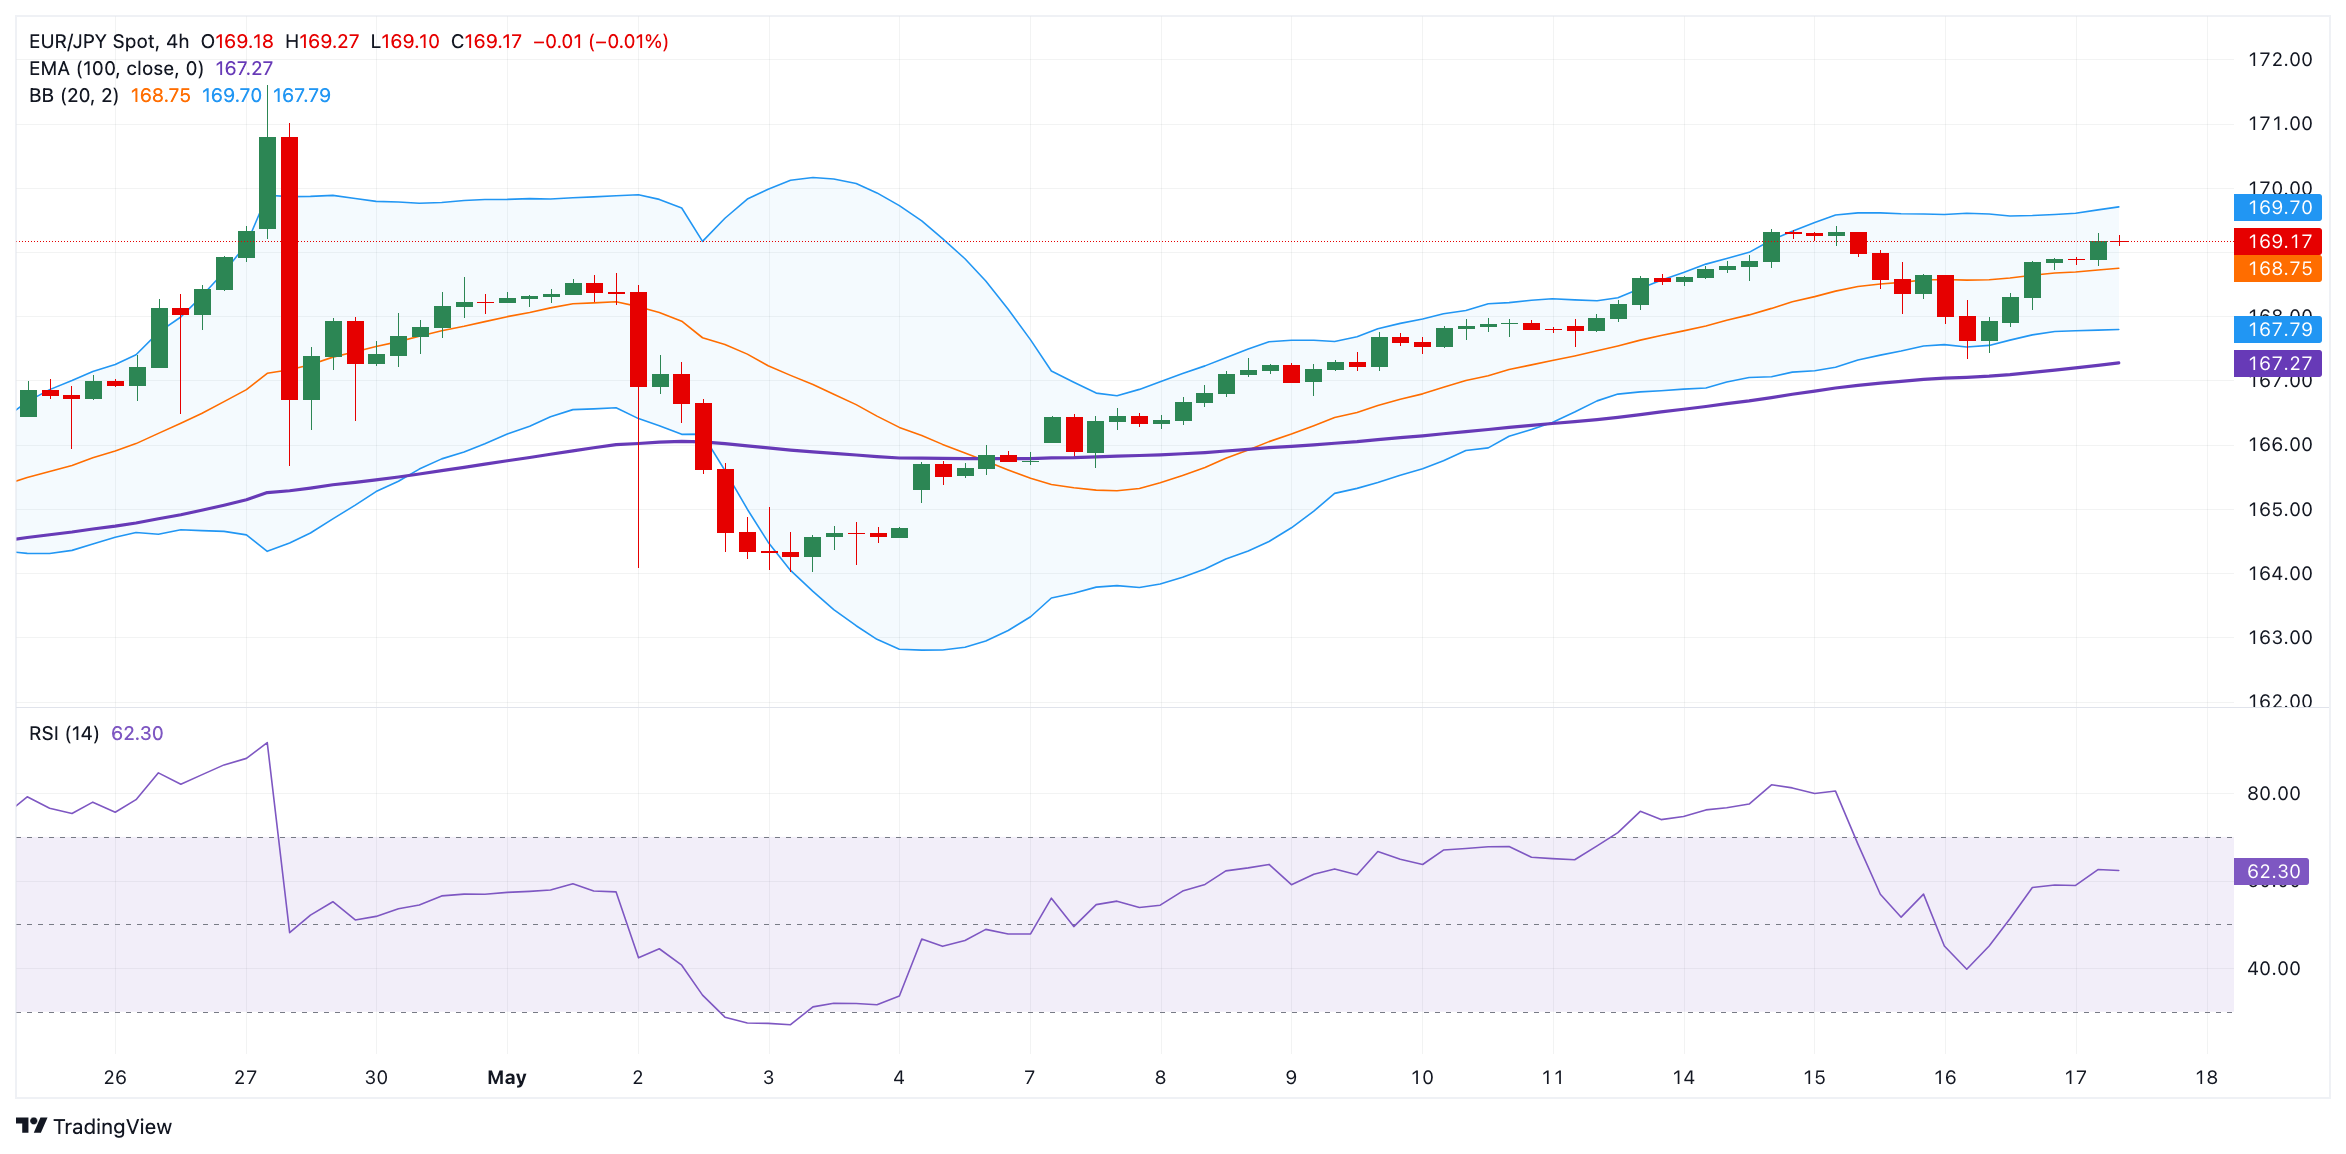
Technically, EUR/JPY maintains the bullish outlook unchanged as the cross holds above the 100-period Exponential Moving Averages (EMA) on the four-hour chart. The upward momentum is backed by the Relative Strength Index (RSI), which stands in bullish territory near 62.60, supporting the buyers for the time being.
The immediate resistance level for the cross will emerge near a high of May 15 at 169.40. The additional upside filter to watch is the 170.00 psychological round figure. A decisive break above the latter will see a rally to the next barrier around a high of April 29 at 171.60.
On the flip side, the first downside target is seen at the 100-period EMA at 167.80. Further south, the next contention level is located near a low of May 16 at 167.33, followed by a low of April 29 at 165.66.
EUR/JPY four-hour chart


© 2000-2026. All rights reserved.
This site is managed by Teletrade D.J. LLC 2351 LLC 2022 (Euro House, Richmond Hill Road, Kingstown, VC0100, St. Vincent and the Grenadines).
The information on this website is for informational purposes only and does not constitute any investment advice.
The company does not serve or provide services to customers who are residents of the US, Canada, Iran, The Democratic People's Republic of Korea, Yemen and FATF blacklisted countries.
Making transactions on financial markets with marginal financial instruments opens up wide possibilities and allows investors who are willing to take risks to earn high profits, carrying a potentially high risk of losses at the same time. Therefore you should responsibly approach the issue of choosing the appropriate investment strategy, taking the available resources into account, before starting trading.
Use of the information: full or partial use of materials from this website must always be referenced to TeleTrade as the source of information. Use of the materials on the Internet must be accompanied by a hyperlink to teletrade.org. Automatic import of materials and information from this website is prohibited.
Please contact our PR department if you have any questions or need assistance at pr@teletrade.global.
transfers