- Analytics
- News and Tools
- Market News
- NZD/USD Price Analysis: Buyers take a breather after Wednesday’s rally, outlook remains positive
NZD/USD Price Analysis: Buyers take a breather after Wednesday’s rally, outlook remains positive
- The daily RSI shows that the pair has strong positive momentum, approaching overbought conditions but turning flat.
- Hourly RSI indicates a slight retreat, hinting at some short-term consolidation.
- The pair remains firm above its main SMAs, signaling a solid bullish sentiment in the near and distant future.
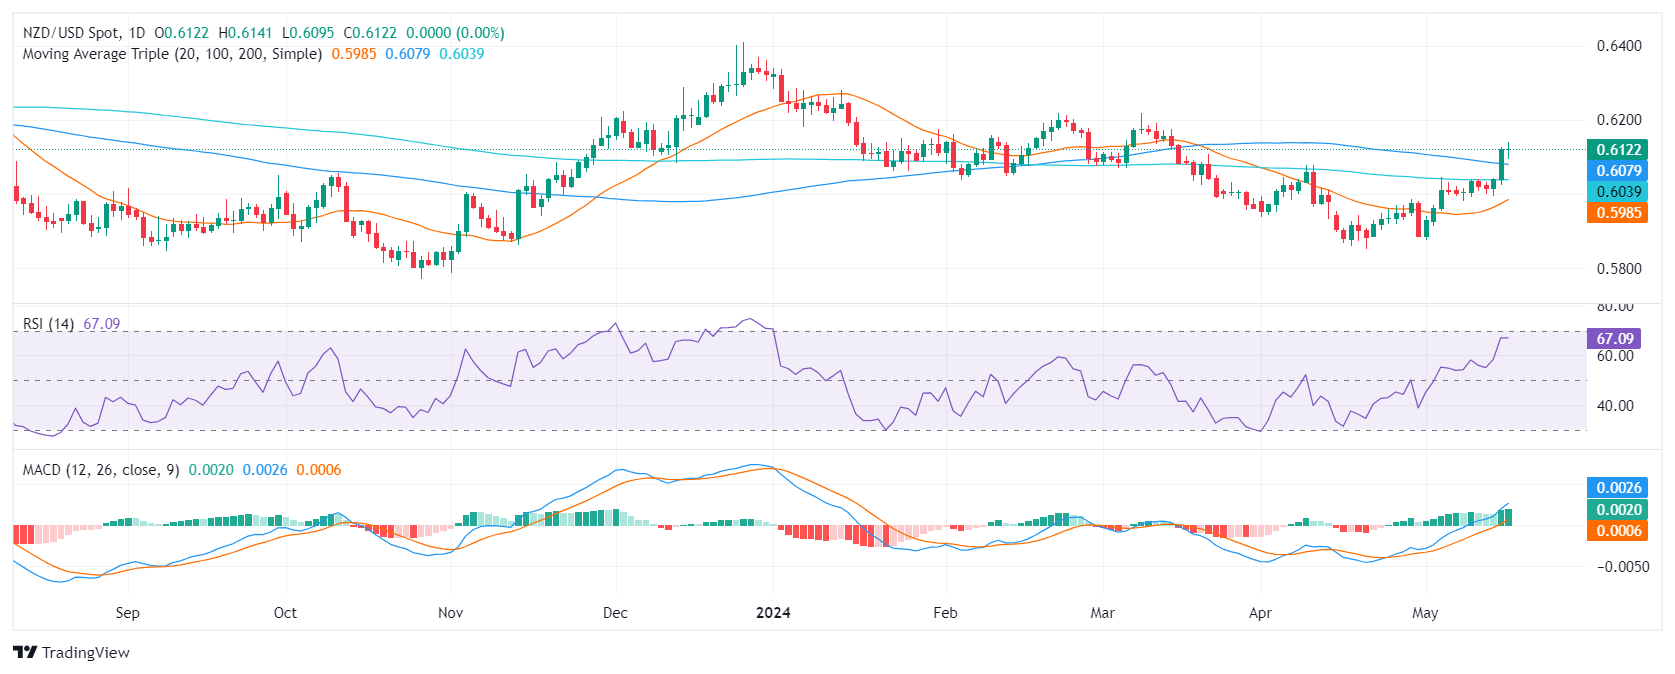
On Thursday's session, the NZD/USD remained flat at around 0.6120, as investors seem to be taking profits. After the Kiwi jumped above its main Simple Moving Averages (SMAs) the outlook turned bullish for the pair, but further consolidation may be in the horizon.
On the daily chart, the Relative Strength Index (RSI) shows positive momentum, fluctuating within positive territory, and nearing overbought status but turned flat on Thursday. The green bars of the Moving Average Convergence Divergence (MACD) reinforce the positive trend but are also flattened.
NZD/USD daily chart
Moving to the hourly chart, mixed signals are visible. The RSI retreated slightly after being deep in overbought terrain, revealing a subtle slowdown in buying enthusiasm in recent hours. The red bars of the MACD suggest that the buying traction was weak in the last hours.
NZD/USD hourly chart
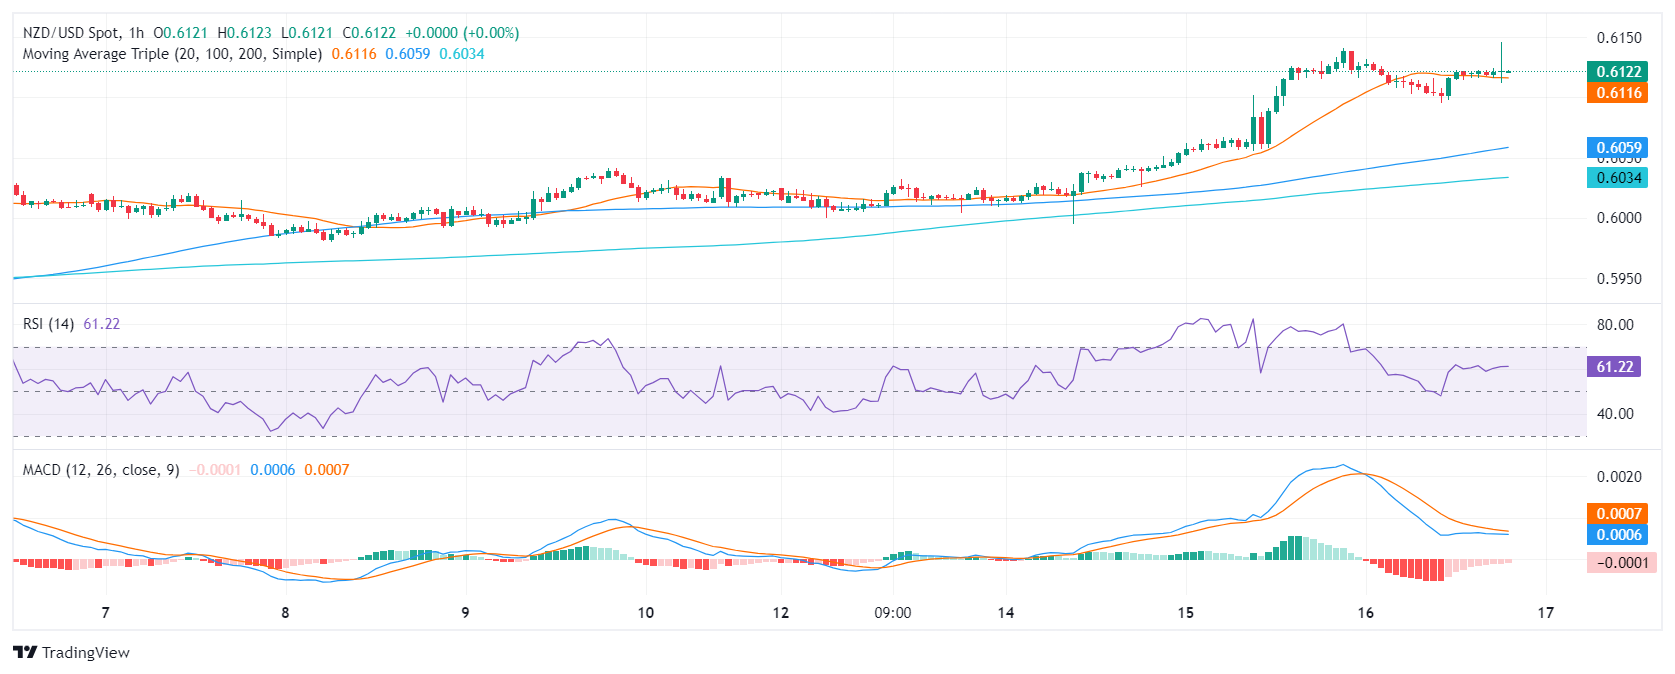
To conclude, bearing in mind the positive RSI indicators and the green MACD histogram, alongside the currency pair being above critical SMAs, the market seems to favor the bulls for the NZD/USD pair in both the short and long term but further consolidation shouldn’t be taken off the table. However, the conquered 100- and 200-day SMA will be a strong support that could limit losses.


© 2000-2026. All rights reserved.
This site is managed by Teletrade D.J. LLC 2351 LLC 2022 (Euro House, Richmond Hill Road, Kingstown, VC0100, St. Vincent and the Grenadines).
The information on this website is for informational purposes only and does not constitute any investment advice.
The company does not serve or provide services to customers who are residents of the US, Canada, Iran, The Democratic People's Republic of Korea, Yemen and FATF blacklisted countries.
Making transactions on financial markets with marginal financial instruments opens up wide possibilities and allows investors who are willing to take risks to earn high profits, carrying a potentially high risk of losses at the same time. Therefore you should responsibly approach the issue of choosing the appropriate investment strategy, taking the available resources into account, before starting trading.
Use of the information: full or partial use of materials from this website must always be referenced to TeleTrade as the source of information. Use of the materials on the Internet must be accompanied by a hyperlink to teletrade.org. Automatic import of materials and information from this website is prohibited.
Please contact our PR department if you have any questions or need assistance at pr@teletrade.global.
transfers