- Analytics
- News and Tools
- Market News
- Silver Price Analysis: XAG/USD rally pauses as ‘doji’ emerges as US yields climb
Silver Price Analysis: XAG/USD rally pauses as ‘doji’ emerges as US yields climb
- Silver trades at $29.60, posting slight losses of 0.04% amid mixed US economic data.
- Technical outlook shows a ‘doji’ pattern, signaling indecision among traders.
- Silver must stay above $29.00 to challenge the YTD high of $29.79 and further resistance levels at $32.15 and $35.40.
Silver’s advancement paused on Thursday, as the grey metal posted minuscule losses of 0.04%, exchanging hands virtually unchanged. Jobs data, along with mixed housing data and the lack of strength in the manufacturing and industrial sectors, boosted US yields and the Greenback. Therefore, the grey metal dropped and traded at $29.60 at the time of writing.
XAG/USD Price Analysis: Technical outlook
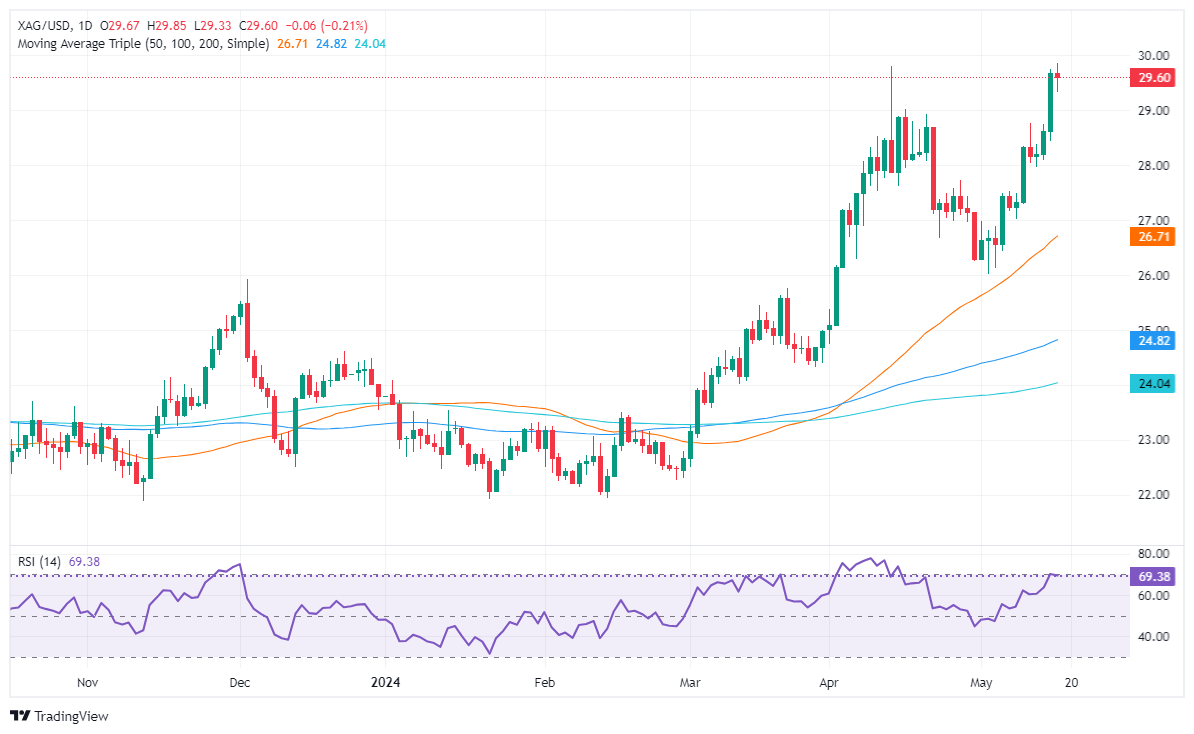
Silver’s uptrend remains in place, but Thursday’s price action forming a ‘doji’ indicates that neither buyers nor sellers are in the domain of price action. It should be said that a ‘double top’ looms. However, momentum favors the former, as the Relative Strength Index (RSI) continues to aim upward despite approaching overbought conditions.
That said, if XAG/USD stays above $29.00, buyers could remain hopeful of testing the year-to-date (YTD) high of $29.79. A breach of the latter will pave the way to challenge the February 2013 high of $32.15, followed by the October 2012 high of $35.40.
Conversely, sellers must drag Silver’s price below the $29.00 figure. In that outcome, the pullback could reach the May 18, 2021, high turned support at $28.75, followed by the $28.00 mark. Further losses lie below the latter, with key support seen at $27.00.
XAG/USD Price Action – Daily Chart


© 2000-2026. All rights reserved.
This site is managed by Teletrade D.J. LLC 2351 LLC 2022 (Euro House, Richmond Hill Road, Kingstown, VC0100, St. Vincent and the Grenadines).
The information on this website is for informational purposes only and does not constitute any investment advice.
The company does not serve or provide services to customers who are residents of the US, Canada, Iran, The Democratic People's Republic of Korea, Yemen and FATF blacklisted countries.
Making transactions on financial markets with marginal financial instruments opens up wide possibilities and allows investors who are willing to take risks to earn high profits, carrying a potentially high risk of losses at the same time. Therefore you should responsibly approach the issue of choosing the appropriate investment strategy, taking the available resources into account, before starting trading.
Use of the information: full or partial use of materials from this website must always be referenced to TeleTrade as the source of information. Use of the materials on the Internet must be accompanied by a hyperlink to teletrade.org. Automatic import of materials and information from this website is prohibited.
Please contact our PR department if you have any questions or need assistance at pr@teletrade.global.
transfers