- Analytics
- News and Tools
- Market News
- EUR/USD reaches for 1.0900, easing US CPI inflation pummels Greenback
EUR/USD reaches for 1.0900, easing US CPI inflation pummels Greenback
- EUR/USD climbs on broad-market Greenback selloff.
- US CPI inflation eases further, sparking Fed rate cut hopes.
- Bets for September rate cut firm up.
EUR/USD climbed on Wednesday in one of the pair’s single-best days of 2024, climbing towards 1.0900 and on pace to etch in a fourth consecutive gain week. Broad-market selling pressure deflated the US Dollar (USD) after risk appetite roared to the forefront after US Consumer Price Index (CPI) inflation eased more than investors expected.
US CPI inflation eased to 0.3% MoM, below median market forecasts of a steady 0.4% print and triggering a broad-market risk rally as sentiment pinned further into hope for an approaching rate cut from the Federal Reserve (Fed) in September. According to the CME’s FedWatch Tool, rate markets are pricing in over 70% odds of at least a quarter-point rate trim when the Fed meets in September.
European final Gross Domestic Product (GDP) figures broadly came in as expected for the first quarter, with Q1 GDP printing at 0.3% QoQ, which is in line with forecasts and the previous quarter’s growth. The rest of the week is strictly mid-tier data releases on both sides of the Atlantic, leaving markets to wistfully look ahead to whether or not the Fed will cut interest rates late in the third quarter.
EUR/USD technical outlook
EUR/USD is taking a bullish run at the 1.0900 handle as the pair extends a bullish bounce from the 200-hour Exponential Moving Average (EMA) from 1.0730. The 200-hour EMA is rising above 1.0780, but intraday bidding has dragged EUR/USD well above technical indicators, and the pair is up over 2.7% from April’s swing low near 1.0600.
Daily candles pierced the 200-day EMA at 1.0798 on Wednesday, but a descending pattern of lower highs threatens a clean extension with a near-term technical ceiling priced in from 1.0950.
EUR/USD hourly chart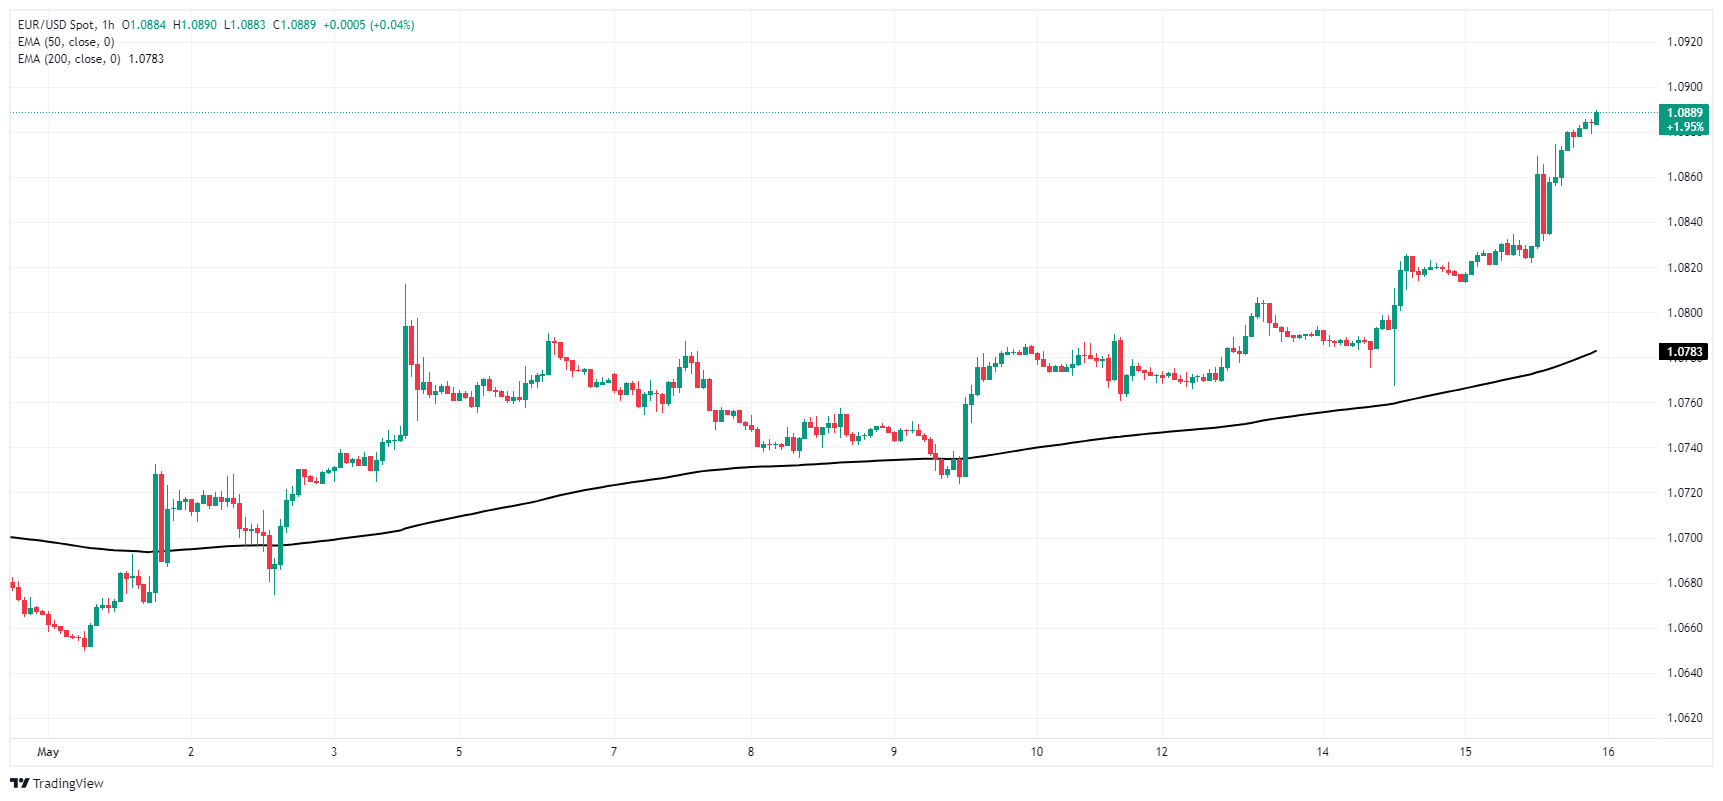
EUR/USD daily chart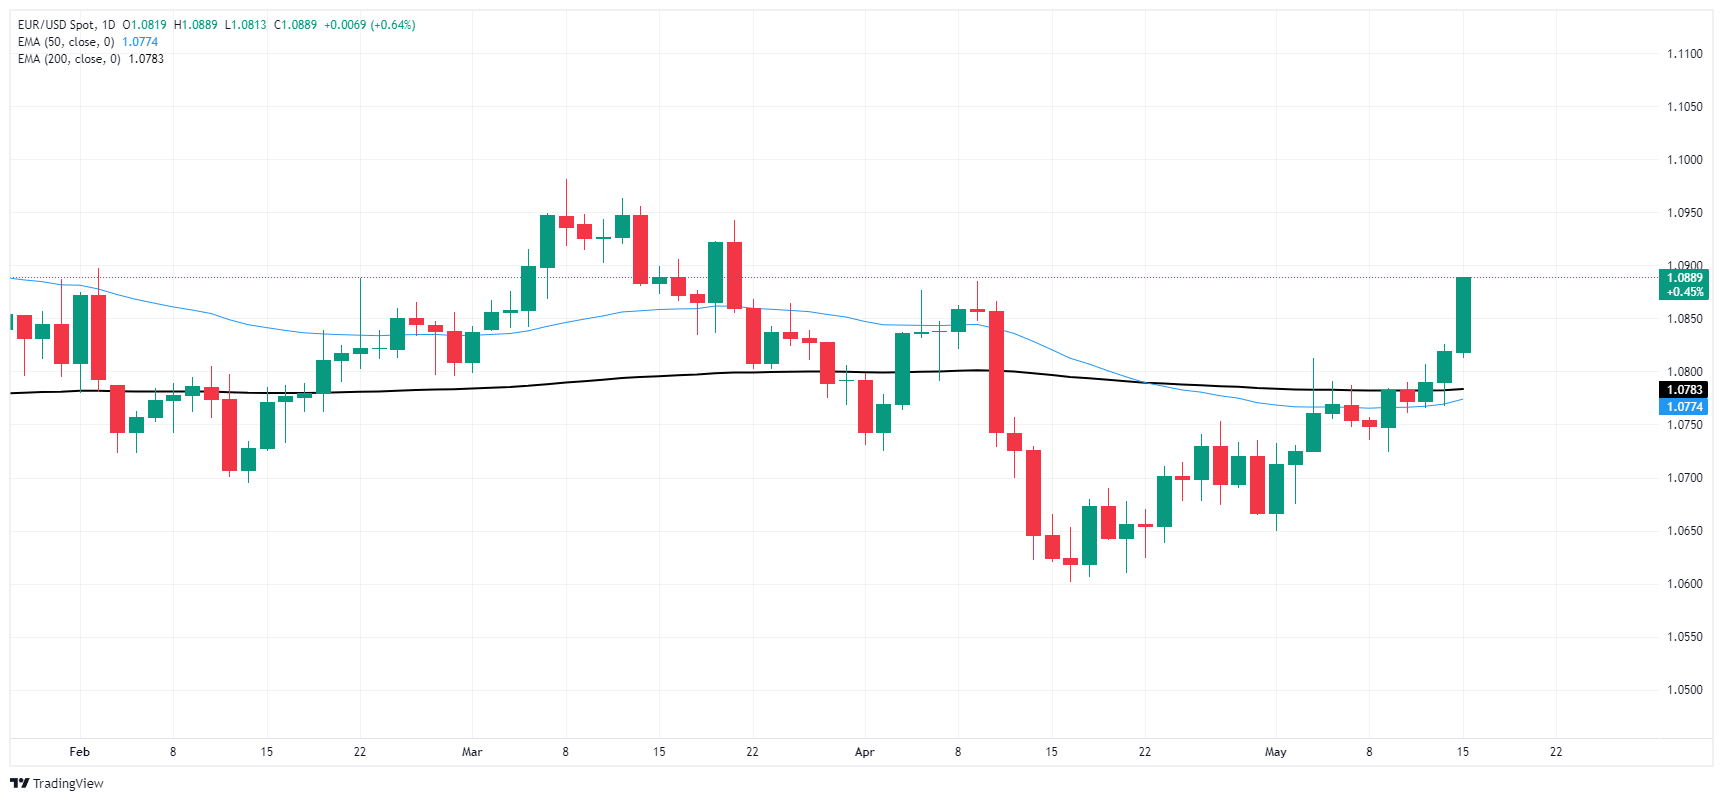


© 2000-2026. All rights reserved.
This site is managed by Teletrade D.J. LLC 2351 LLC 2022 (Euro House, Richmond Hill Road, Kingstown, VC0100, St. Vincent and the Grenadines).
The information on this website is for informational purposes only and does not constitute any investment advice.
The company does not serve or provide services to customers who are residents of the US, Canada, Iran, The Democratic People's Republic of Korea, Yemen and FATF blacklisted countries.
Making transactions on financial markets with marginal financial instruments opens up wide possibilities and allows investors who are willing to take risks to earn high profits, carrying a potentially high risk of losses at the same time. Therefore you should responsibly approach the issue of choosing the appropriate investment strategy, taking the available resources into account, before starting trading.
Use of the information: full or partial use of materials from this website must always be referenced to TeleTrade as the source of information. Use of the materials on the Internet must be accompanied by a hyperlink to teletrade.org. Automatic import of materials and information from this website is prohibited.
Please contact our PR department if you have any questions or need assistance at pr@teletrade.global.
transfers