- Analytics
- News and Tools
- Market News
- NZD/USD Price Analysis: Bulls gather traction and brighten the outlook, indicators hit overbought conditions
NZD/USD Price Analysis: Bulls gather traction and brighten the outlook, indicators hit overbought conditions
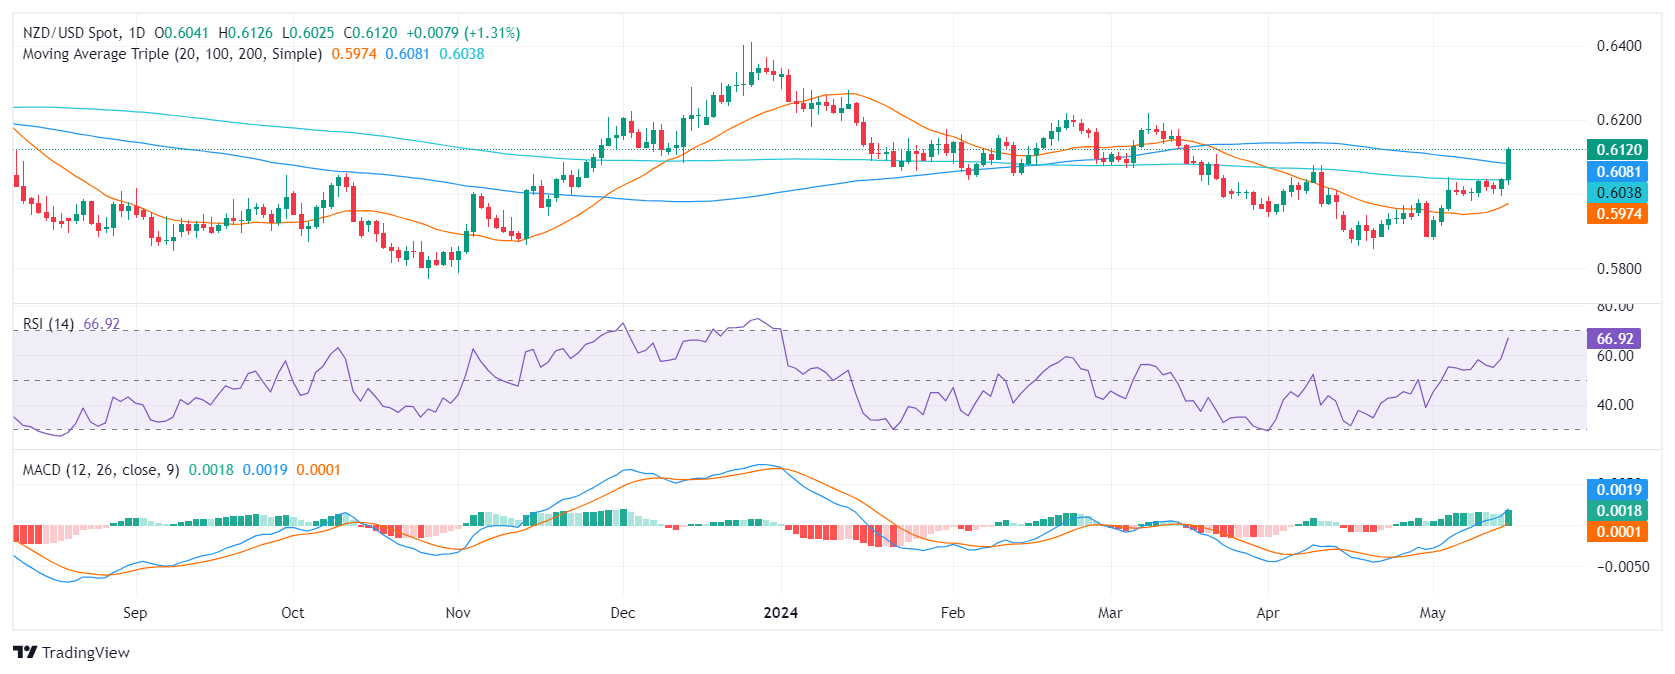
- The daily RSI of the NZD/USD signals it is approaching overbought, which often indicates future consolidation or potential reversal.
- The same indicators in the hourly chart further strengthen this view, specifically, with the RSI crossing the 70 mark.
- Buyers regained the 100 and 200-day SMAs, and this points to a bullish outlook.
In the Wednesday session, the NZD/USD pair rides a strong bullish wave, with a recent increase of 1.28%. The uptick made the pair jump above its 100 and 200-day Simple Moving Averages (SMAs), indicating that the outlook turned positive for the pair. However, as indicators approach overbought conditions, a consolidation may be incoming.
On the daily chart, the Relative Strength Index (RSI) indicates that NZD/USD is approaching overbought territory. The positive trend evident over the past few days, along with the recent surge, reveals that the strength is currently with buyers. However, this upward pressure may soon decrease, as the RSI nearing overbought conditions often signals future consolidation or potential reversal.
NZD/USD daily chart
The hourly chart shows that RSI readings exceeded 70, reinforcing indications of overbought conditions. The recent Moving Average Convergence Divergence (MACD) showing flat green bars indicates sustained but flat positive momentum.
NZD/USD hourly chart
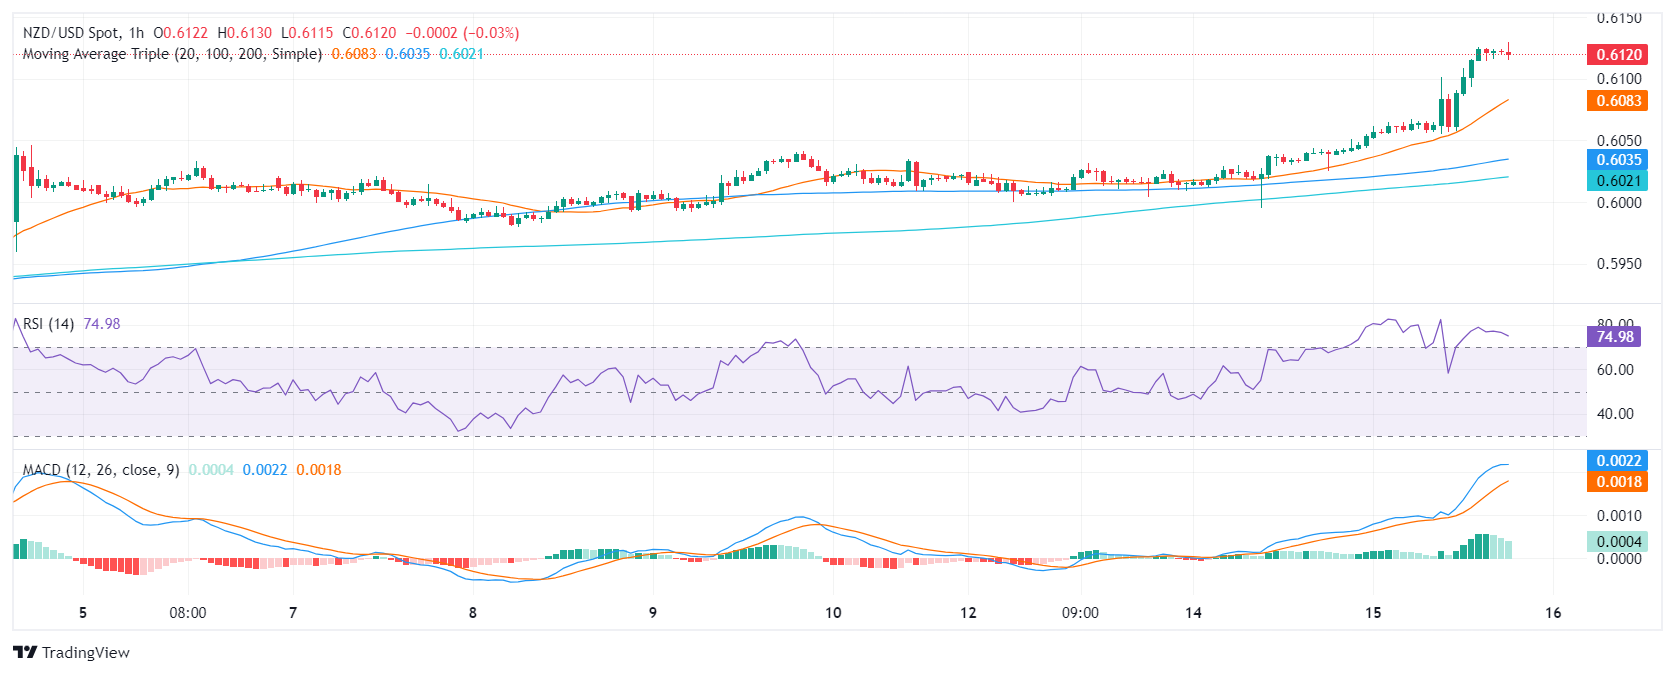
In conclusion, the technical indicators for NZD/USD suggest strong buyer momentum. However, the RSI's proximity to overbought conditions hints at a potential easing of this upward pressure. This, coupled with the strong bullish trend indicated by the jumping above longer-term SMAs, presents a positive outlook but demands careful observation for potential corrections.


© 2000-2026. All rights reserved.
This site is managed by Teletrade D.J. LLC 2351 LLC 2022 (Euro House, Richmond Hill Road, Kingstown, VC0100, St. Vincent and the Grenadines).
The information on this website is for informational purposes only and does not constitute any investment advice.
The company does not serve or provide services to customers who are residents of the US, Canada, Iran, The Democratic People's Republic of Korea, Yemen and FATF blacklisted countries.
Making transactions on financial markets with marginal financial instruments opens up wide possibilities and allows investors who are willing to take risks to earn high profits, carrying a potentially high risk of losses at the same time. Therefore you should responsibly approach the issue of choosing the appropriate investment strategy, taking the available resources into account, before starting trading.
Use of the information: full or partial use of materials from this website must always be referenced to TeleTrade as the source of information. Use of the materials on the Internet must be accompanied by a hyperlink to teletrade.org. Automatic import of materials and information from this website is prohibited.
Please contact our PR department if you have any questions or need assistance at pr@teletrade.global.
transfers