- Analytics
- News and Tools
- Market News
- USD/SEK declines as markets digest US Retail Sales and CPI figures
USD/SEK declines as markets digest US Retail Sales and CPI figures
- US CPI and Retail Sales came in lower than expected.
- The odds of a cut from the Fed in July slightly increase, and September continues being the best-case scenario.
- Fed officials might change their tone as economic figures showed softness.
On Wednesday, the USD/SEK saw sharp losses as the potential for sooner interest rate cuts by the Fed, in light of the recent Consumer Price Index (CPI) disinflation and lackluster Retail Sales, may exert weight on the USD.
On the data front, the US Bureau of Labor Statistics reported that the US witnessed a marginal decrease in inflation, with the headline CPI moving down from 3.5% in March to 3.4% in April. Core CPI also observed a fall, retreating from 3.8% to 3.6%, aligning with market expectations. In addition, U.S. Retail sales in April remained stagnant, a dip from the anticipated 0.4% growth.
The cooling economic indicators imply that the Federal Reserve might contemplate a sooner start of the easing cycle which would invariably exert pressure on the USD. The CME FedWatch Tool highlights that investors have already priced in that there will be no changes in interest rates in June, but continue seeing with good eyes a cut in September. Those odds slightly increase for the July meeting but remain low.
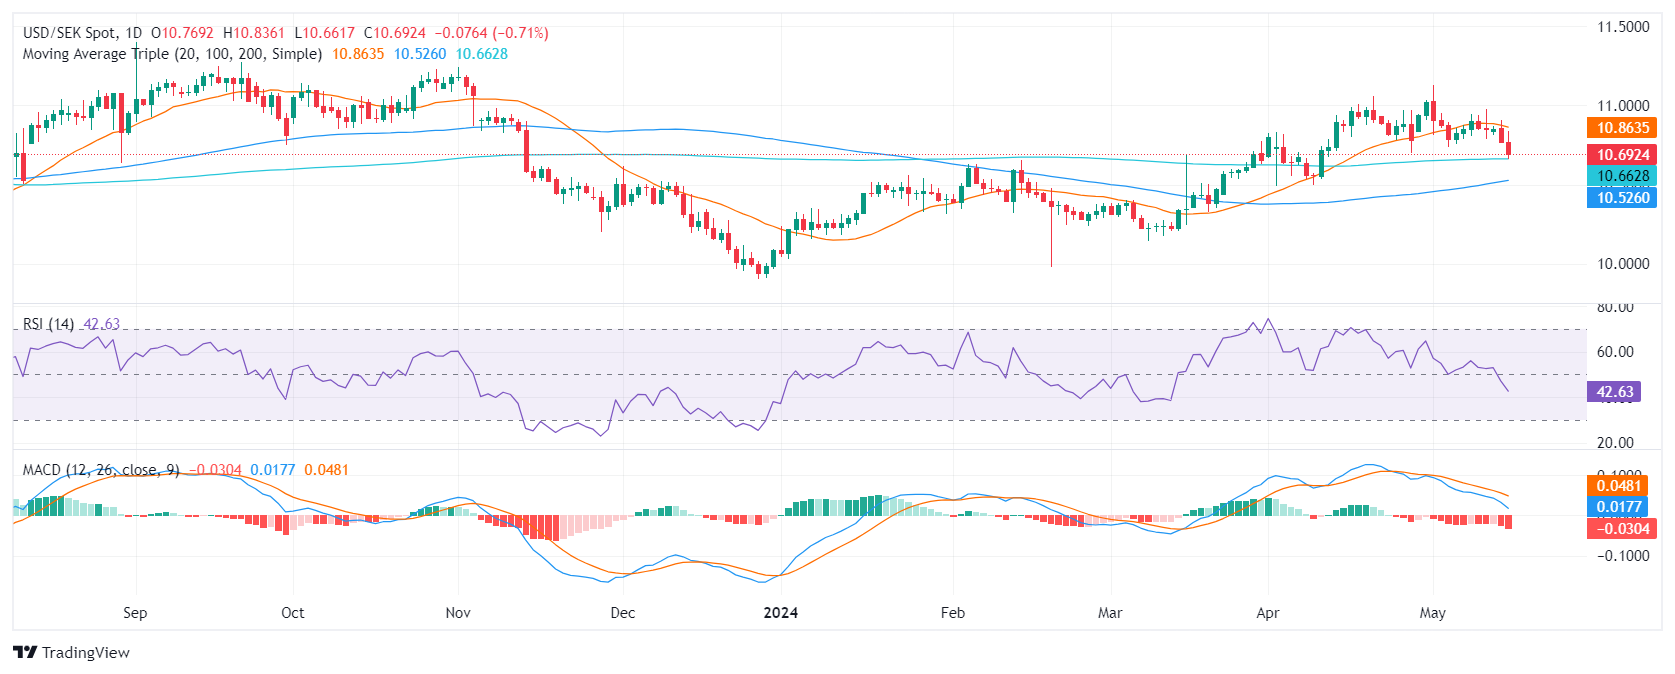
USD/SEK technical analysis
On the daily chart, the Relative Strength Index (RSI) for the USD/SEK pair resides in negative territory. The latest reading, marking a downward trend, suggests that sellers are dominating. Moreover, the Moving Average Convergence Divergence (MACD) is producing rising red bars, thus demonstrating negative momentum.
That being said, strong support was noted at the 200-day Simple Moving Average (SMA) with buyers defending the level at 10.66. This defense acts as a crucial bulwark against any potential downward trend reversals.


© 2000-2026. All rights reserved.
This site is managed by Teletrade D.J. LLC 2351 LLC 2022 (Euro House, Richmond Hill Road, Kingstown, VC0100, St. Vincent and the Grenadines).
The information on this website is for informational purposes only and does not constitute any investment advice.
The company does not serve or provide services to customers who are residents of the US, Canada, Iran, The Democratic People's Republic of Korea, Yemen and FATF blacklisted countries.
Making transactions on financial markets with marginal financial instruments opens up wide possibilities and allows investors who are willing to take risks to earn high profits, carrying a potentially high risk of losses at the same time. Therefore you should responsibly approach the issue of choosing the appropriate investment strategy, taking the available resources into account, before starting trading.
Use of the information: full or partial use of materials from this website must always be referenced to TeleTrade as the source of information. Use of the materials on the Internet must be accompanied by a hyperlink to teletrade.org. Automatic import of materials and information from this website is prohibited.
Please contact our PR department if you have any questions or need assistance at pr@teletrade.global.
transfers