- Analytics
- News and Tools
- Market News
- GBP/USD Price Analysis: Peaks at five-week high, fails to challenge 1.2700
GBP/USD Price Analysis: Peaks at five-week high, fails to challenge 1.2700
- GBP/USD climbs past 100-DMA, with buyers gaining traction.
- Buying interest remains strong, as RSI points upwards, yet to become overbought.
- Key resistance lies at 1.2670, which would exacerbate followed by 1.2700.
- Sellers target a close below the 100-DMA to challenge 1.2600.
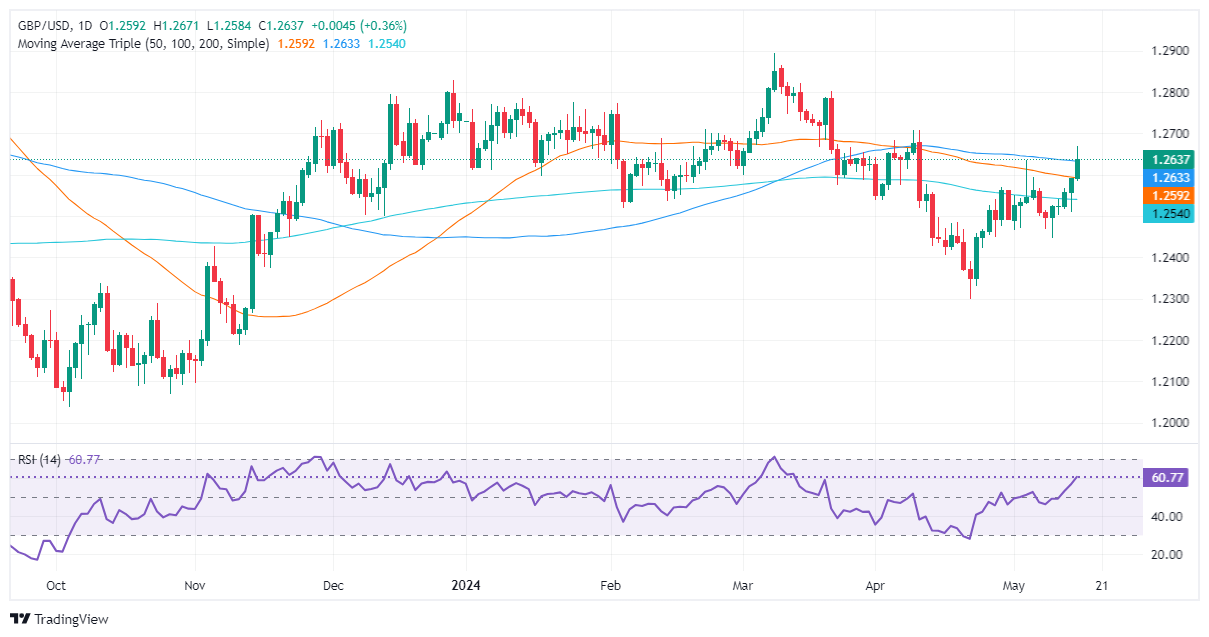
The Pound Sterling advanced some 0.30% and hit a five-week high of 1.2670 following the release of the US Consumer Price Index (CPI). The data was mostly aligned with estimates, showing a continuation of the disinflation process, which weighed on the Greenback. The GBP/USD trades at 1.2641 at the time of writing.
GBP/USD Price Analysis: Technical outlook
The GBP/USD remains neutral to upward bias and hit a weekly high at 1.2670 following a soft US inflation report. However, the pair has retreated toward the 100-day moving average (DMA) at 1.2632, seen as the next key technical level that, once surpassed, could pave the way for further gains.
The Relative Strength Index (RSI) shows that momentum favors buyers. The RSI aims upward with enough room before portraying overbought conditions.
If buyers reclaim the 100-DMA, the next resistance would be today’s high at 1.2670. A breach of the latter will expose the April 9 high at 1.2709, ahead of rallying to the next supply zone at 1.2803, the March 21 high. Once surpassed, the next stop would be the year-to-date (YTD) high at 1.2894.
Conversely, sellers remain hopeful that the GBP/USD exchange rate could tumble below the 100-DMA and achieve a daily close below that level, to challenge 1.2600. Once cleared, the next stop would be the 50-DMa at 1.2591, followed by the 200-DMA at 1.2539.
GBP/USD Price Action – Daily Chart


© 2000-2026. All rights reserved.
This site is managed by Teletrade D.J. LLC 2351 LLC 2022 (Euro House, Richmond Hill Road, Kingstown, VC0100, St. Vincent and the Grenadines).
The information on this website is for informational purposes only and does not constitute any investment advice.
The company does not serve or provide services to customers who are residents of the US, Canada, Iran, The Democratic People's Republic of Korea, Yemen and FATF blacklisted countries.
Making transactions on financial markets with marginal financial instruments opens up wide possibilities and allows investors who are willing to take risks to earn high profits, carrying a potentially high risk of losses at the same time. Therefore you should responsibly approach the issue of choosing the appropriate investment strategy, taking the available resources into account, before starting trading.
Use of the information: full or partial use of materials from this website must always be referenced to TeleTrade as the source of information. Use of the materials on the Internet must be accompanied by a hyperlink to teletrade.org. Automatic import of materials and information from this website is prohibited.
Please contact our PR department if you have any questions or need assistance at pr@teletrade.global.
transfers