- Analytics
- News and Tools
- Market News
- EUR/USD Price Analysis: Breaks above descending trend channel, the next barrier is seen above 1.0880
EUR/USD Price Analysis: Breaks above descending trend channel, the next barrier is seen above 1.0880
- EUR/USD attracts some buyers to 1.0825 amid weaker USD on Wednesday.
- The pair resumes its upside as it holds above the key EMA; RSI indicator stands in bullish territory.
- The next upside barrier is seen at 1.0885; the first downside target is located at 1.0795.
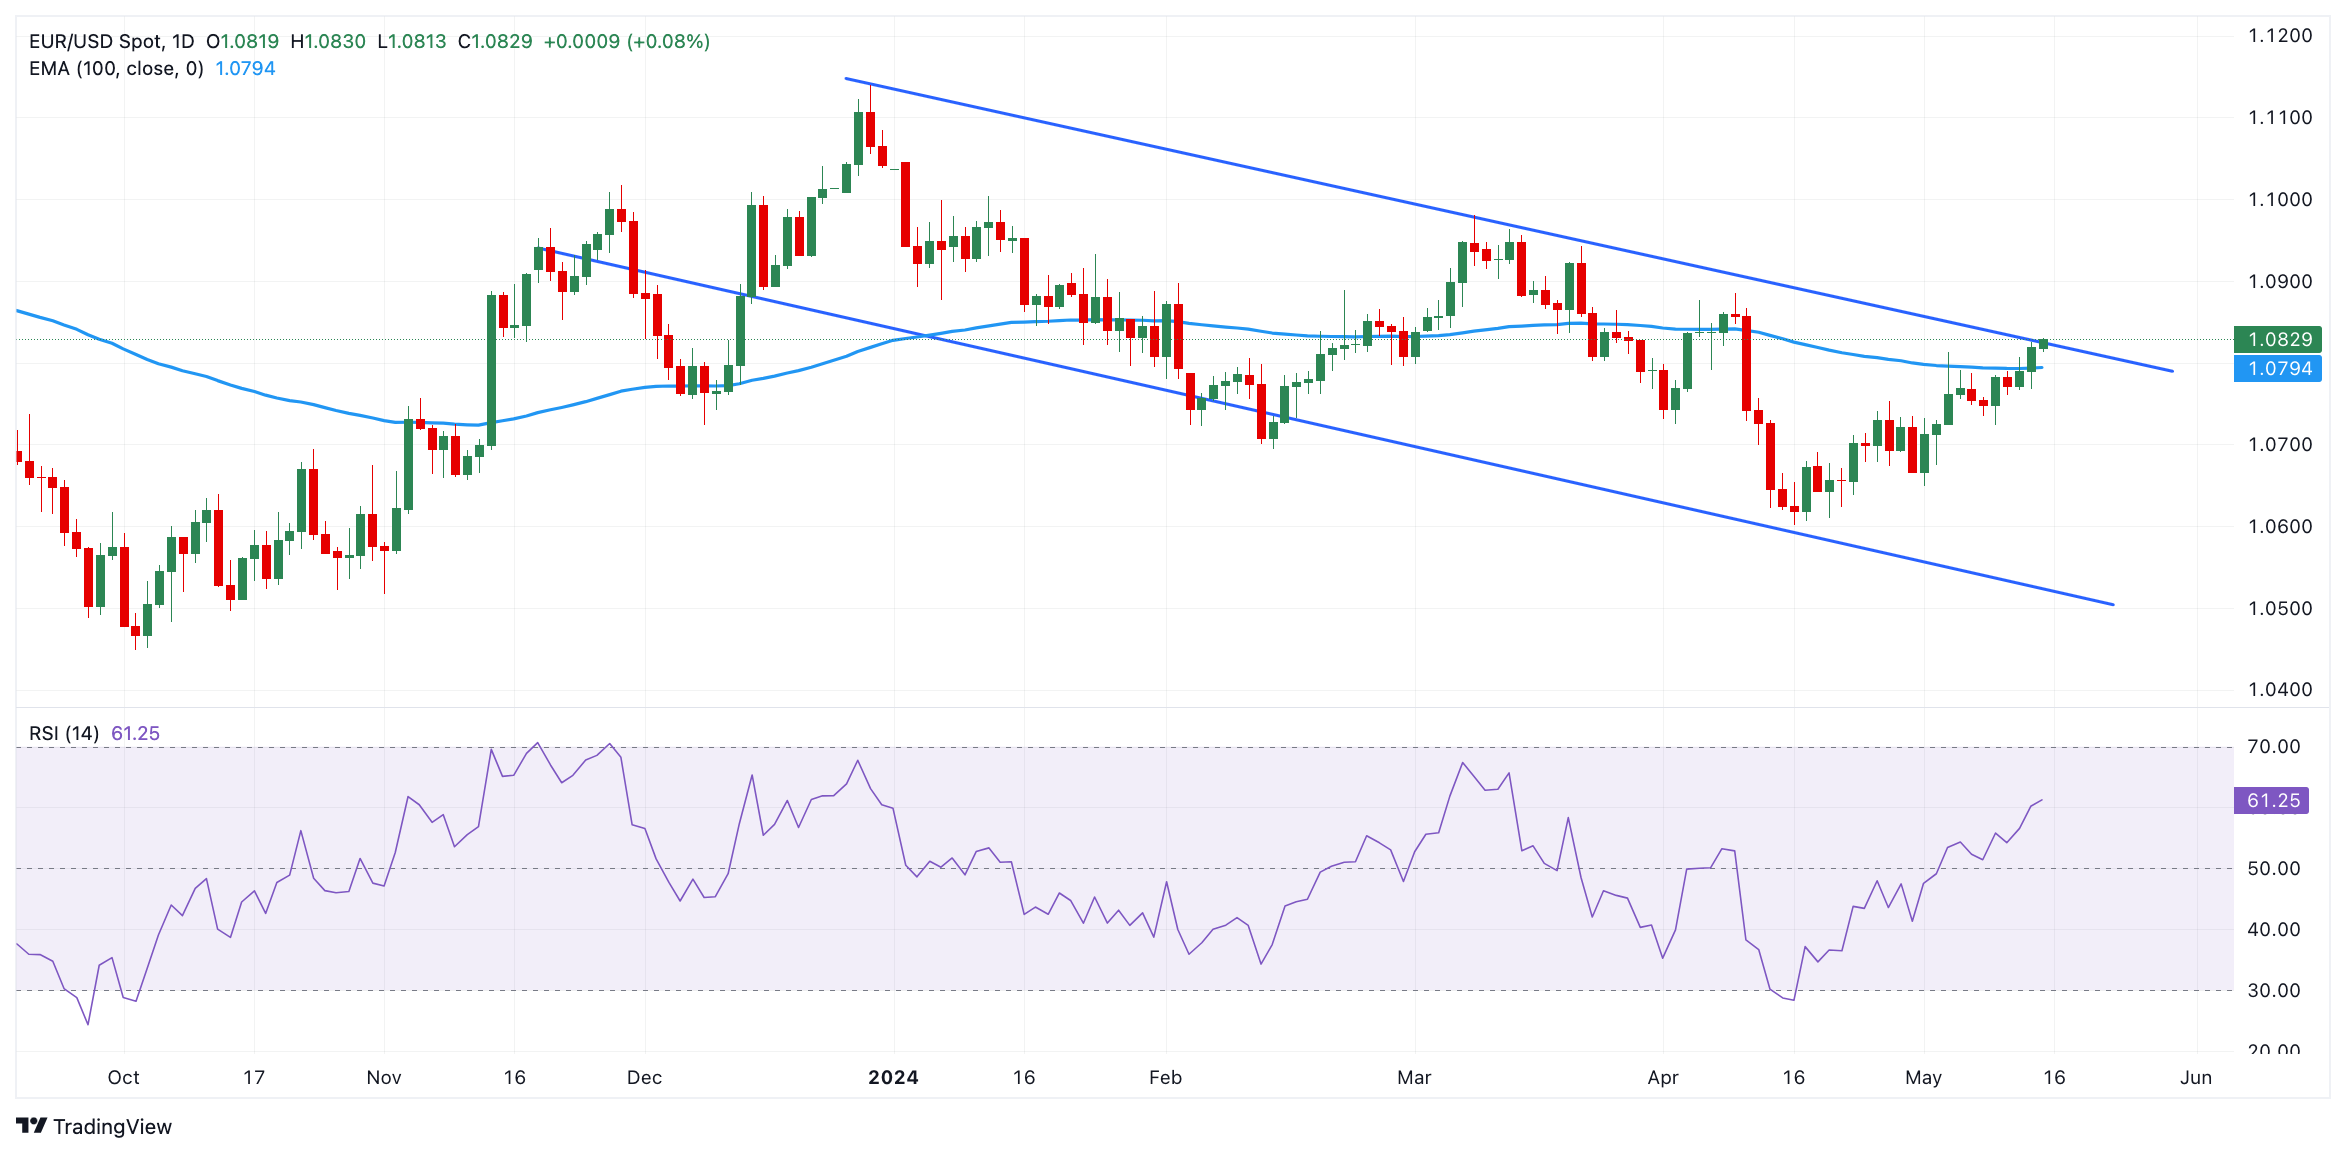
The EUR/USD pair extends the rally near 1.0825 on Wednesday during the early European trading hours. The uptick of the major pair is bolstered by the upbeat ZEW Economic Sentiment Survey and the softer US Dollar (USD). Investors will closely monitor the Eurozone GDP growth number, which is forecast to grow by 0.3% QoQ in the first quarter of 2024.
According to the daily chart, EUR/USD has remained confined in a descending trend channel since mid-December 2023. The bullish outlook of the major pair resumes as it crosses above the key 100-day Exponential Moving Average (EMA). Additionally, the upward momentum is bolstered by the 14-day Relative Strength Index (RSI) stands in bullish territory around 60.80, indicating that further upside looks favorable.
The major pair breaks above the upper boundary of the descending trend channel and the psychological level of 1.0800. The next resistance level is seen at a high of April 9 at 1.0885. The additional upside filter to watch is a high of March 21 at 1.0943, en route to a high of March 8 at 1.0981, and finally the 1.1000 psychological level.
On the other hand, the first downside target for EUR/USD will emerge near the 100-day EMA at 1.0795. Any follow-through selling below this level will see a drop to a low of May 9 at 1.0724. Further south, the next contention level is located around a low of May 2 at 1.0650, followed by a low of April 16 at 1.0600.
EUR/USD daily chart


© 2000-2026. All rights reserved.
This site is managed by Teletrade D.J. LLC 2351 LLC 2022 (Euro House, Richmond Hill Road, Kingstown, VC0100, St. Vincent and the Grenadines).
The information on this website is for informational purposes only and does not constitute any investment advice.
The company does not serve or provide services to customers who are residents of the US, Canada, Iran, The Democratic People's Republic of Korea, Yemen and FATF blacklisted countries.
Making transactions on financial markets with marginal financial instruments opens up wide possibilities and allows investors who are willing to take risks to earn high profits, carrying a potentially high risk of losses at the same time. Therefore you should responsibly approach the issue of choosing the appropriate investment strategy, taking the available resources into account, before starting trading.
Use of the information: full or partial use of materials from this website must always be referenced to TeleTrade as the source of information. Use of the materials on the Internet must be accompanied by a hyperlink to teletrade.org. Automatic import of materials and information from this website is prohibited.
Please contact our PR department if you have any questions or need assistance at pr@teletrade.global.
transfers