- Analytics
- News and Tools
- Market News
- Silver Price Analysis: XAG/USD tests resistance at around $28.70 shy of reclaiming $29.00
Silver Price Analysis: XAG/USD tests resistance at around $28.70 shy of reclaiming $29.00
- Silver rises 1.32% to $28.57, buoyed by lower US Treasury yields and a weakening dollar.
- XAG/USD shows strong upward trend within $28.00-$28.80 range, up from early May low of $26.02.
- To maintain momentum, silver aims to breach $29.00, targeting YTD high of $29.79 and $30.00.
- Support at $28.00; further supports at 38.2% Fib retracement ($27.70) and 50% Fib ($27.06).
Silver's price moved higher late in the North American session due to lower US Treasury yields and a softer US Dollar. Although the latest inflation figures in the US were higher than expected, the non-yielding metal climbed. The XAG/USD trades at $28.57, gains 1.32%.
XAG/USD Price Analysis: Technical outlook
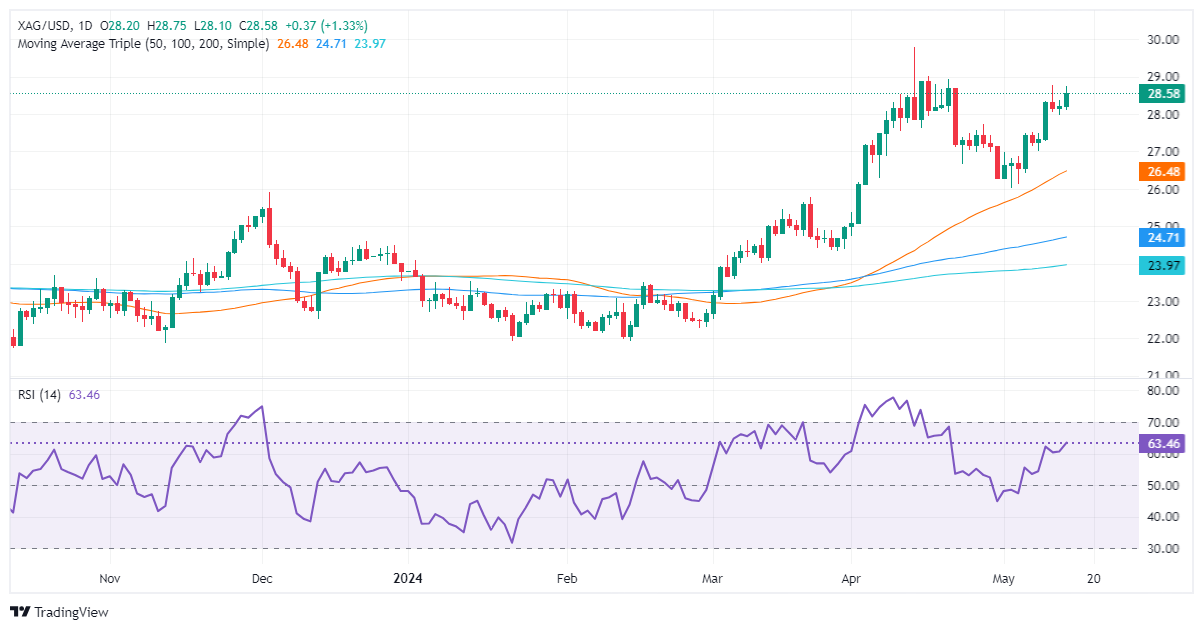
During the last three days, Silver has been seesawing within the $28.00-$28.80 range after registering exponential gains since May 2, which brought the grey metal’s price from around $26.02 to current spot prices.
XAG/USD is upward biased, though is at the brisk of forming a ‘double top.’ Momentum favors buyers, with the Relative Strength Index (RSI) standing at bullish territory.
For a bullish continuation, buyers need to reclaim the $29.00 psychological figure. Once cleared, the next stop would be the year-to-date (YTD) high at $29.79, followed by the $30.00 mark.
Conversely, if sellers stepped in and pushed prices below $28.00, look for further losses. The first demand zone would be the 38.2% Fib retracement at $27.70. A breach of the latter will expose the 50% Fib retracement at $27.06.
XAG/USD Price Action – Daily Chart


© 2000-2026. All rights reserved.
This site is managed by Teletrade D.J. LLC 2351 LLC 2022 (Euro House, Richmond Hill Road, Kingstown, VC0100, St. Vincent and the Grenadines).
The information on this website is for informational purposes only and does not constitute any investment advice.
The company does not serve or provide services to customers who are residents of the US, Canada, Iran, The Democratic People's Republic of Korea, Yemen and FATF blacklisted countries.
Making transactions on financial markets with marginal financial instruments opens up wide possibilities and allows investors who are willing to take risks to earn high profits, carrying a potentially high risk of losses at the same time. Therefore you should responsibly approach the issue of choosing the appropriate investment strategy, taking the available resources into account, before starting trading.
Use of the information: full or partial use of materials from this website must always be referenced to TeleTrade as the source of information. Use of the materials on the Internet must be accompanied by a hyperlink to teletrade.org. Automatic import of materials and information from this website is prohibited.
Please contact our PR department if you have any questions or need assistance at pr@teletrade.global.
transfers